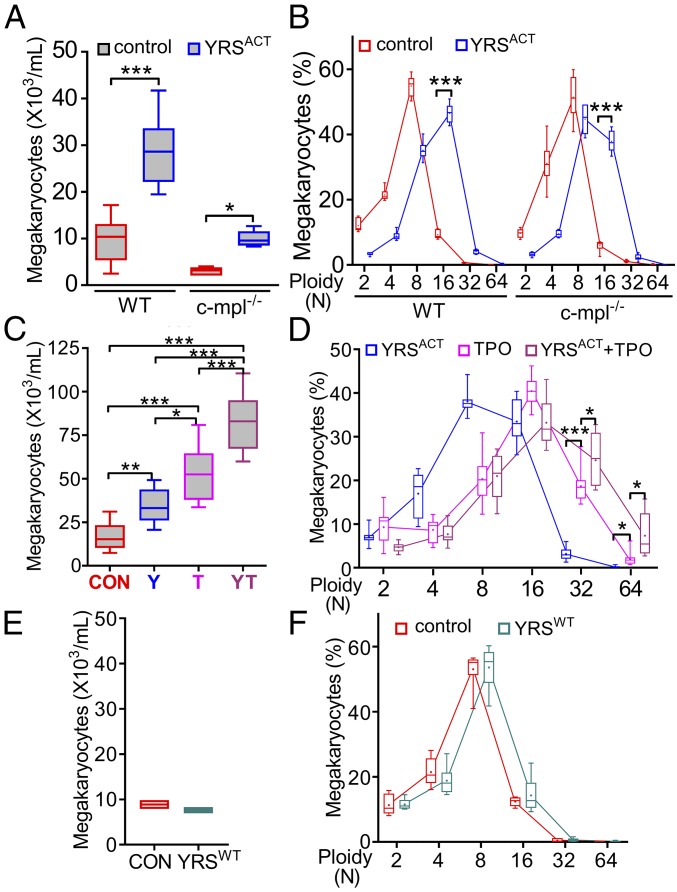
Fig. 2.
YRSACT induces ex vivo MK expansion independent of TPO signaling. (A) BM cells isolated from WT or c-mpl−/− mice (n = 6) were cultured for 3 d with PBS or 100 nM YRSACT and analyzed for MK number. (B) The cultures were analyzed for MK ploidy. Data are shown as 25th to 75th percentile bars with median and min to max whiskers. (C) BM cells isolated from WT mice (n = 12) were treated with 100 nM YRSACT (Y), 1.4 nM TPO (T), YRSACT plus TPO (YT), or PBS as control (CON) for 3 d; MKs were then counted. (D) Selected culture conditions described in C were analyzed for ploidy distribution. Data are shown as in A and B. *P < 0.05, **P < 0.01, ***P < 0.001 determined by one-way ANOVA followed by Sidak’s multiple comparison test (A) or Tukey’s multiple comparison test (C), or two-way ANOVA with Sidak’s multiple comparison test (B and D). (E) Pooled BM cells from two WT mice were cultured with added YRSWT (100 nM) or PBS (CON) for 3 d; MKs were then counted. (F) The cultures described in E were analyzed for ploidy distribution. Data of two experiments with technical triplicates are shown as min to max floating bars with mean. In B and F, color-coded lines join the mean values (marked by a cross indicated inside each bar) of each ploidy distribution.

