Fig. 3.
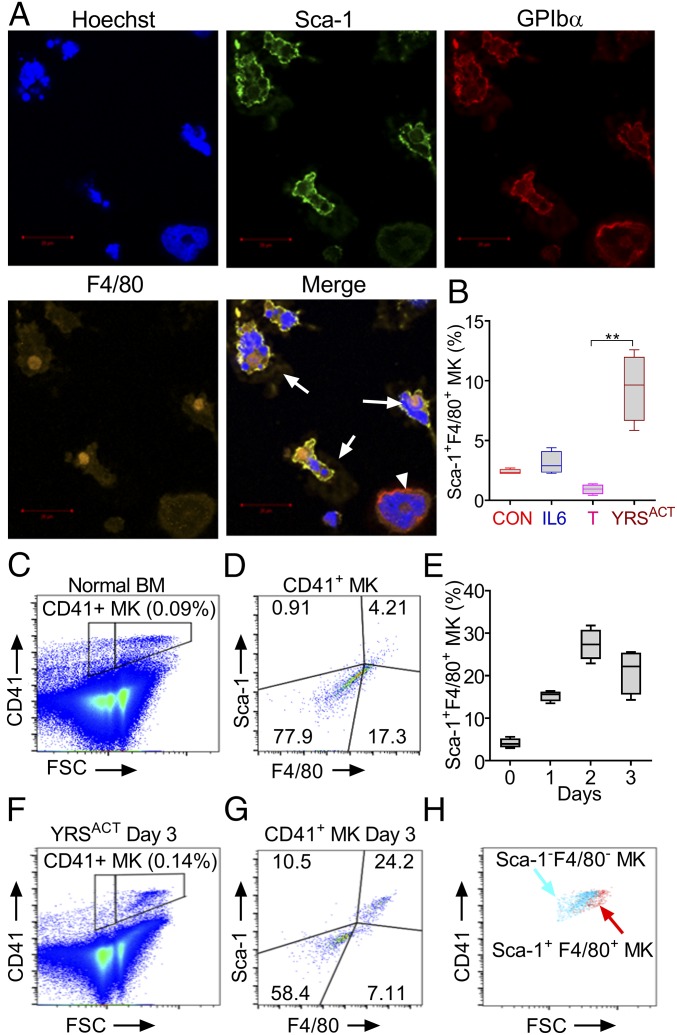
Unique MK population expressing Sca-1 and F4/80 is induced by YRSACT in mouse BM cells cultured in vitro. (A) BM cells isolated from human GPIbα transgenic mice (mGPIbαnull;hGPIbαTg) and cultured in the presence of 100 nM YRSACT for 3 d were analyzed by immunofluorescent staining and confocal microscopy. MKs were identified by staining with anti-hGPIbα antibody (LJ-1b1). Arrows indicate Sca-1+F4/80+ MKs; the arrowhead indicates a Sca-1−F4/80− MK. (B) WT mouse BM cells (n = 4) were treated with 2.3 nM IL-6 (IL6), 1.4 nM TPO (T), 100 nM YRSACT, or PBS as control (CON) for 3 d and analyzed by flow cytometry. **P < 0.01 determined by one-way ANOVA with Dunn’s multiple comparison test. (C) BM cells freshly isolated from a WT mouse were gated for MKs based on CD41 binding and FSC. (D) MKs gated in C analyzed for Sca-1 and F4/80 expression. (E) Time course of Sca-1+F4/80+ MK expansion (%) after YRSACT addition to BM cell cultures. (F) WT mouse BM cells treated with 100 nM YRSACT for 3 d were gated for MKs as in C. (G) MKs gated in F analyzed for Sca-1 and F4/80 expression. (H) Sca-1−F4/80− and Sca-1+F4/80+ MKs identified in G were backgated for CD41 expression and size (FSC) showing that Sca-1+F4/80+ MKs are larger than Sca-1−F4/80− MKs.

