Fig. 2.
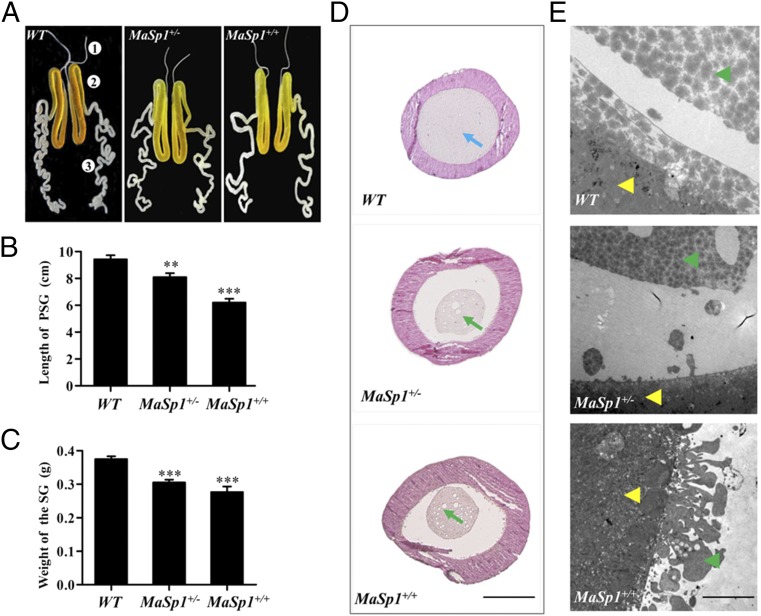
Developmental phenotypes of silk glands in WT, MaSp1+/−, and MaSp1+/+ animals. (A) Gross morphology of the silk glands of WT, MaSp1+/−, and MaSp1+/+. The PSGs of MaSp1+/− and MaSp1+/+ were shorter in length than that in the WT animals. Numbers of 1, 2, and 3 indicate the anterior silk gland (ASG), middle silk gland (MSG), and PSG, respectively. (B) The statistical analysis of the length of the PSG (n = 10). Error bar: SD; ** and *** represent significant differences at the 0.01 and 0.001 level (t test) compared with the control. (C) The statistical analysis of the weight of the intact silk gland (n = 10). Error bar: SD; *** represents significant difference at the 0.001 level (t test) compared with the control. (D) Paraffin-embedded sections of the PSG from WT, MaSp1+/−, and MaSp1+/+ animals at the fourth day of the fifth instar stage. Tissues were stained with hematoxylin–eosin and were photographed under a bright field. Blue arrowheads indicate normal internal secretion structures, and green arrowheads indicate the atrophic secretion, which was smaller and vacuolated in MaSp1+/− and MaSp1+/+ animals. (Scale bar: 0.2 mm.) (E) The boundary of the epidermal tissue and secretion examined by the TEM. The yellow arrows show the epidermal tissue of the PSG, and the green arrows show the internal secretion. (Scale bar: 5 μm.)

