Fig. 3.
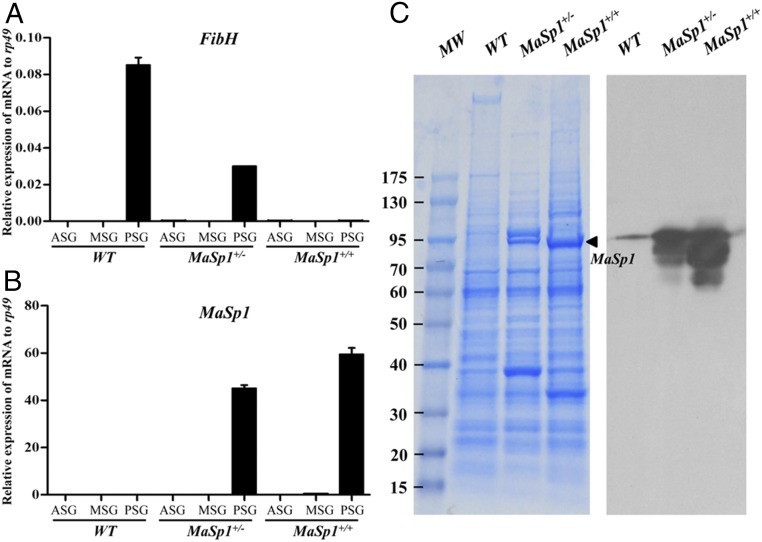
MaSp1 expression in silk glands of transformed animals. (A) Relative mRNA expression of FibH determined using qRT-PCR in WT, MaSp1+/−, and MaSp1+/+ animals. ASG, MSG, and PSG were separated for investigation. The results are expressed as the means ± SD of three independent biological replicates. (B) Relative mRNA expression of MaSp1 determined using qRT-PCR in WT, MaSp1+/−, and MaSp1+/+ animals. (C) MaSp1 protein in PSG was subjected to SDS/PAGE analysis followed by Coomassie brilliant blue staining (Left) or Western blotting analysis (Right). Thin band in the WT lane was due to spillover from the large amount of MaSp1 present in the other lanes. The number in the left indicates the protein marker (kilodaltons). The black arrows show the MaSp1 protein.

