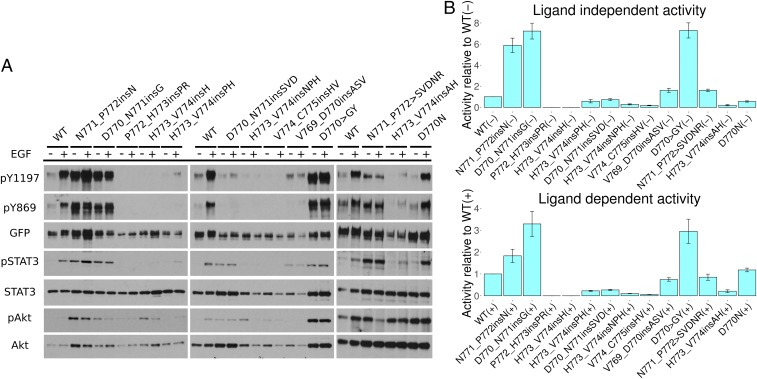
Fig. 2.
Cell-based screening of EGFR insertion mutations. (A) Western blot of 13 different EGFR mutations. The – and indicate the absence and presence of EGF ligand. Autophosphorylation activity is indicated by Y1197 and Y869 phosphorylation. GFP signal indicates the total expression level of EGFR. Downstream signaling of STAT3 and Akt is also shown. (B) Densitometry analysis of the relative phosphorylation activity of various EGFR insertion mutations compared with WT. The ratio between Y1197 and GFP signal is used as a measure of activity. The score for each insertion mutation is normalized to WT EGFR. Both ligand-independent activity (Top) and ligand-dependent activity (Bottom) are shown. SE bars represent three to five independent experiments.

