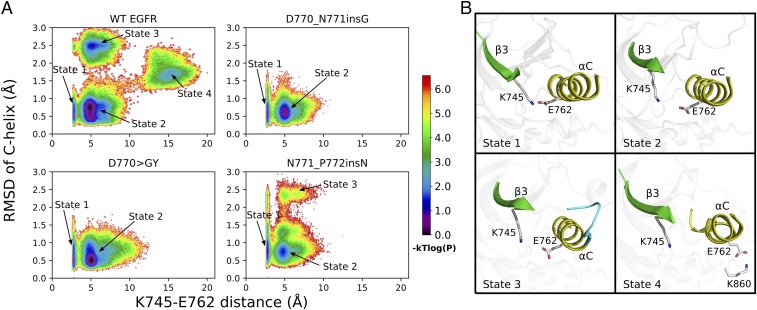
Fig. 5.
MD simulation of EGFR and three activating insertion mutations in the active state. (A) The joint distribution of the K745/NZ–E762/(OE1,OE2) distance and the C-helix rmsd is shown in logarithmic scale. The plot is constructed using 100 different bins on both axes. The probability of each bin is estimated using the frequency of the 3-s MD snapshots that fall into each bin. The distribution plot is transformed into an energy unit by , where is set to 1.0 in generating the contour image. Four distinct state clusters are labeled. (B) Representative snapshots from each conformational state labeled in A are shown.

