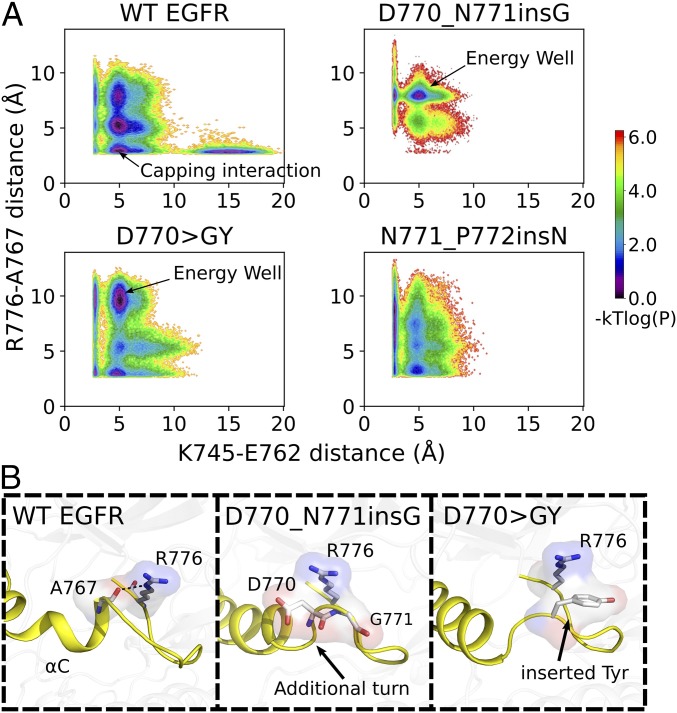
Fig. 6.
Modulation of autoinhibitory capping interactions [R776/(NE,NH1,NH2)–A767/O hydrogen bonds] by activating insertion mutations. (A) The joint distribution of K745–E762 distance and R776–A767 distance is shown in logarithmic scale. The same binning and log-transformation procedure as used in Fig. 5A was followed to generate the plot. (B) Representative snapshots from the energy wells (indicated by arrows in A).

