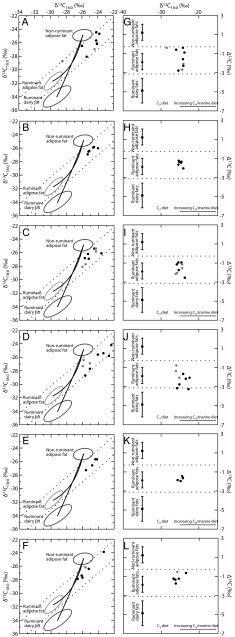
Fig. 2.
Fatty acid carbon isotope compositions of lipids extracted from ceramic vessels from Çatalhöyük (TP area). (A–F) δ13C values for the C16:0 and C18:0 fatty acids prepared from animal fat residues extracted from sherds from Çatalhöyük (TP area) from phases M–R, respectively. The three fields correspond to the P = 0.684 confidence ellipses for animals raised on a strict C3 diet in Britain (20). The analytical error (±0.3‰) is approximately the size of the points on the graph. (G–L) Δ13C values from the same potsherds. Ranges show the mean ± 1 SD for a global database comprising modern reference animal fats from United Kingdom (animals raised on a pure C3 diet), Africa, Kazakhstan, Switzerland, and the Near East (17). Each data point represents an individual vessel. Samples from which δ2H values of C16:0 and C18:0 fatty acids were obtained (Fig. 1D) are in black.

