Fig. 4.
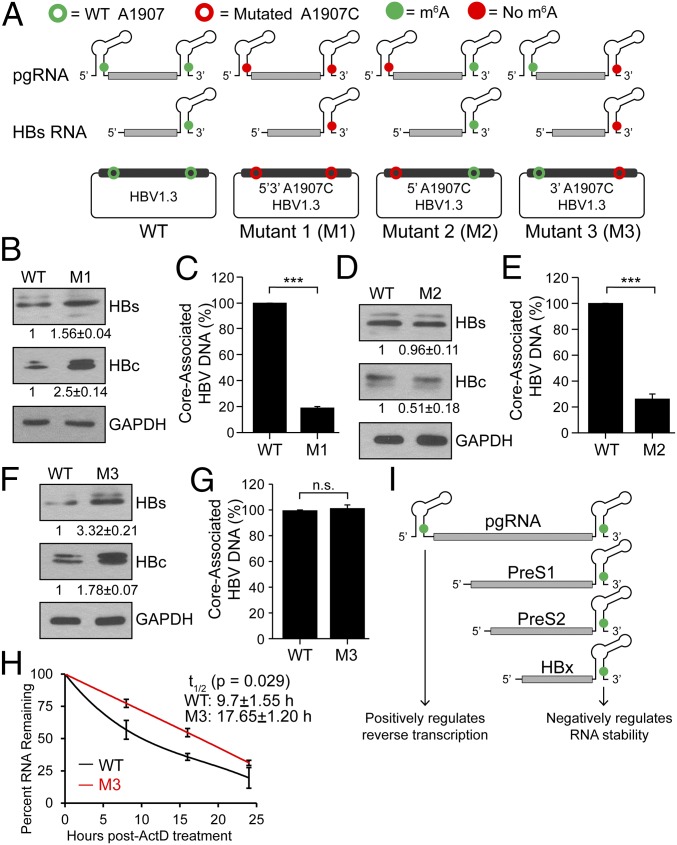
Mutations of 5′ and 3′ DRACH motifs and their effect on HBV protein expression and DNA synthesis. (A) Schematics indicate the location of the A1907C mutations of 5′ and 3′ m6A sites in HBV RNAs. Open circles represent WT (green) and A1907C mutations (red) in HBV plasmid DNA. Green solid circles indicate m6A modification while red solid circles represent lack of m6A (due to A1907C mutations) in encoded RNAs. HBV-M1 having the A1907C mutation at both termini, HBV-M2 only at the 5′ end, and HBV-M3 only at the 3′ end. (B–G) Immunoblot analysis of HBV proteins following transfection of indicated HBV constructs in HepG2 cells with relative quantifications below the respective blots [(B) M1, (D) M2, (F) M3] and core-associated DNA isolated from core particles and quantified by qPCR using equal amounts of purified DNA in the input. Relative levels of core-associated DNA from the various constructs [(C) M1, (E) M2, (G) M3] graphed as percent relative to HBV-WT. (H) RT-qPCR analysis of relative levels of remaining HBV transcript relative to GAPDH isolated at indicated times following 24 h of actinomycin D treatment from HBV 1.3mer (WT or M3)-expressing HepG2 cells. (I) Model for how m6A at the 5′ or 3′ epsilon stem loops of HBV transcripts differentially regulates their stability and reverse transcription. Data here are presented from three independent experiments and the bars represent mean ± SD. ***P ≤ 0.001 by unpaired Student’s t test, and n.s., not significant.

