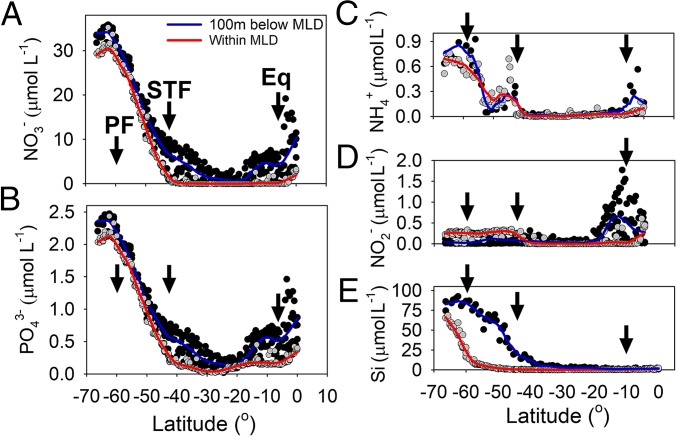
Fig. 2.
Nutrient data: NO3− (A), PO43− (B), NH4+(C), NO2− (D), and SiO4 (E) concentrations expressed in micromoles per liter along the P15S GO-SHIP transect. Gray circles are data from the surface to the base of the MLD (including all data within the MLD); thick red lines are negative exponential smoothing curves with a first polynomial degree. Black circles include the data from the base of the MLD to 100 m below the base of the MLD. Thick blue lines are negative exponential smoothing curves with a first polynomial degree. The black arrows on all panels highlight the oceanic PF, STF, and equatorial upwelling and divide the latitudinal transect into oceanic provinces defined by Longhurst (25).

