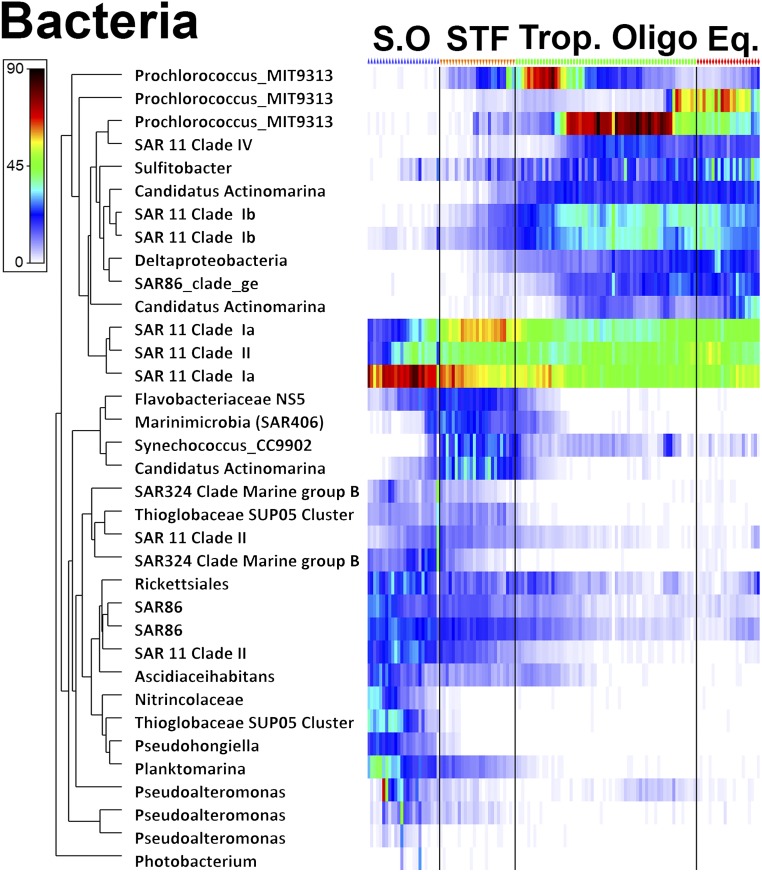
Fig. 7.
Heatmap of the bacterial domain. The most abundant sequences of the rarefied OTU matrix are displayed. Sequence reads were square root transformed (note: chloroplasts included in the16S amplicon data were removed from the analysis). The color bar denotes sequence abundance. Blue, orange, green, and red symbols above the heatmap denote CTD stations in the respective oceanographic biomes: the Southern Ocean (S.O), the STF, the tropical oligotrophic (Trop. Oligo.), and the equatorial upwelling (Eq.).

