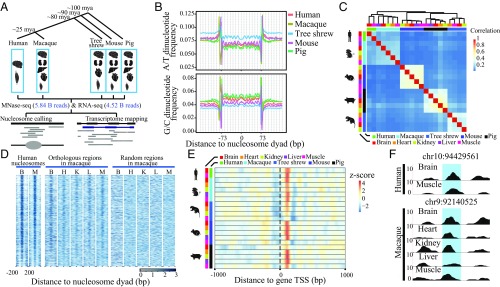
Fig. 1.
Nucleosome occupancy profiles are conserved across species and tissues. (A) Overview of the experimental design. A tree showing the phylogenetic relationships between humans and four outgroup species, with estimated divergence times marked on the branches. The tissue samples used in the MNase-seq and RNA-seq are shown, along with the total number of sequencing reads. (B) Dinucleotide frequencies of A/T (the combined dinucleotide frequency of AA/AT/TA/TT) and G/C (the combined dinucleotide frequency of CC/CG/GC/GG) in nucleosome-protected regions in brain samples of the five species are shown. Nucleosome dyad, the midpoint position of the DNA bound by the nucleosome core. (C) Hierarchical clustering chart showing the correlations of nucleosome occupancy profiles in different tissue samples of the five species. (D) Heat map of nucleosome occupancy profiles for human samples and nucleosome occupancy profiles at macaque orthologous regions, as well as at properly aligned, randomly selected macaque genomic regions. The nucleosome occupancy profiles for all human nucleosome-occupied regions detected in both of the two human samples are shown. B, brain; H, heart; K, kidney; L, liver; M, muscle. (E) For all of the orthologous genes across the five species, the nucleosome occupancy profile near the TSS is shown in heat map, with focal TSS indicated by a dotted line. (F) The nucleosome occupancy profiles of two human tissues in one human chromosome region, together with the profiles of multiple macaque tissues in the orthologous regions are shown. In each profile, a 147-bp window, shaded in blue, indicates a region occupied by one nucleosome with the coordinate of its midpoint shown above each panel.

