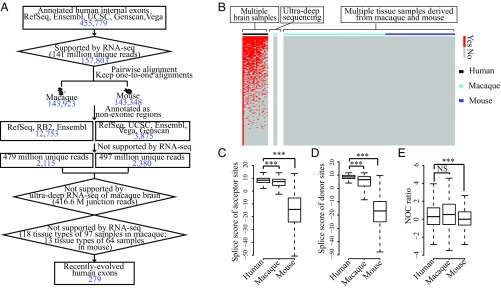
Fig. 3.
Differential nucleosome occupancy appears before the origination of exons. (A) Flowchart identifying recently evolved human exons based on RNA-seq data and gene annotations. The number of human exons in each step of the flowchart is indicated in blue. Ensembl, gene annotations from Ensembl; Genscan, gene predictions from Genscan program; RB2, gene annotations from RhesusBase (version 2); RefSeq, gene annotations from NCBI Reference Sequence Database; UCSC, gene annotations from University of California, Santa Cruz genome browser; Vega, gene annotations from the Vertebrate Genome Annotation database. (B) Heat map showing the expression of recently evolved human exons in brain samples of different individuals, as well as the expression of the orthologous regions in macaque and mouse animals. Horizontal red bars indicate the existence of exon expression. Splice site scores of (C) acceptor sites and (D) donor sites and (E) NOC ratios are shown in boxplots for recently evolved exons in human and orthologous regions in macaque and mouse. NS, not significant; *P ≤ 0.05; **P ≤ 0.01; ***P ≤ 0.001.

