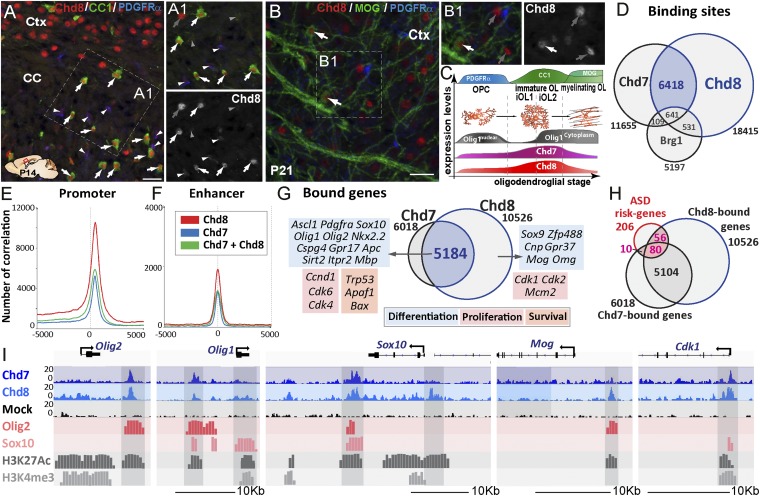
Fig. 3.
Chd8 binds together with Chd7 to OPC differentiation, proliferation, and survival genes. (A) Chd8 immunolabeling of P14 brain sections showing Chd8 expression in all maturing OLs (CC1high-expressing cells, arrows) of the CC, as well as in neurons of the cortex (Ctx). (A1) Detail of the Inset in A showing that, beside the high Chd8 expression in maturing OLs (white arrows) and neurons (gray arrows), a low level of Chd8 expression is detected in few OPCs (PDGFRα+ cells, white arrowheads) but is hardly detectable in astrocytes (CC1low-expressing cells, gray arrowheads). (Scale bar, 20 μm.) (B) Immunofluorescence at P21 showing young mature MOG+ OLs still expressing Chd8 (white arrows). (B1) Detail of the Inset shown in B; gray arrows correspond to Chd8+ neurons. (Scale bar, 20 μm.) (C) Summary representation of Chd8 and Chd7 expression at different stages of the OL cell lineage, as identified by PDGFRα, CC1, and MOG expression. (D) Venn diagrams depicting the overlap of Chd7-, Chd8-, and Brg1-binding sites in OPCs. (E and F) Graph showing the number of correlations of Chd7 (blue), Chd8 (red), and Chd7-Chd8 (green) peaks in OPCs compared with the position in promoter regions (E) or enhancer regions (F). (G) Overlap of Chd7- and Chd8-bound genes in OPCs with examples of genes involved in OL cell differentiation (blue), cell death (orange), and cell cycle (red). (H) Overlap between ASD-risk genes and Chd7- and Chd8-bound genes in OPCs. (I) Representative ChIP-seq tracks for Chd8 and control IgG together with Olig2, Sox10, Chd7, and active epigenetic marks (H3K27ac and H3K4me3) in Olig2, Olig1, Sox10, Mog, and Cdk1 gene regions in OPCs.

