Fig. 4.
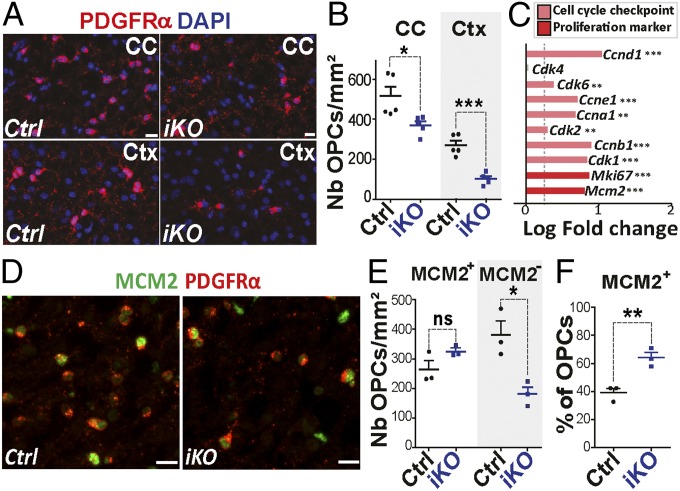
Chd7 LOF in OPCs does not affect cell proliferation. (A) Immunolabeling of PDGFRα+ cells in the CC and cortex (Ctx) of P7 Control (Ctrl) and Chd7iKO (iKO) mice. (Scale bars, 10 μm.) (B) Quantification of PDGFRα+ cells (nb/mm2) in the CC and Ctx of P7 Ctrl and iKO mice. Data are presented as mean ± SEM (n = 5). (C) Barplot representing the log fold-change (LogFC) of genes involved in cell cycle and proliferation between iKO and Ctrl mice. Dashed gray line represent FC = 1.2 (n = 7). (D) Immunostaining of MCM2 and PDGFRα in the CC from P7 Ctrl and iKO mice. (Scale bars, 10 μm.) (E) Quantification of the density of MCM2+ and MCM2− PDGFRα+-OPCs (nb/mm2) in the CC of P7 Ctrl and iKO mice. Data are presented as mean ± SEM (n = 3). (F) Quantification of MCM2+ cells as a percentage of total PDGFRα+ cells in the CC of P7 Ctrl and iKO mice. Data are presented as mean ± SEM (n = 3). Exact P values can be found in Dataset S2. *P < 0.05, **P < 0.01, and ***P < 0.001.

