Fig. 6.
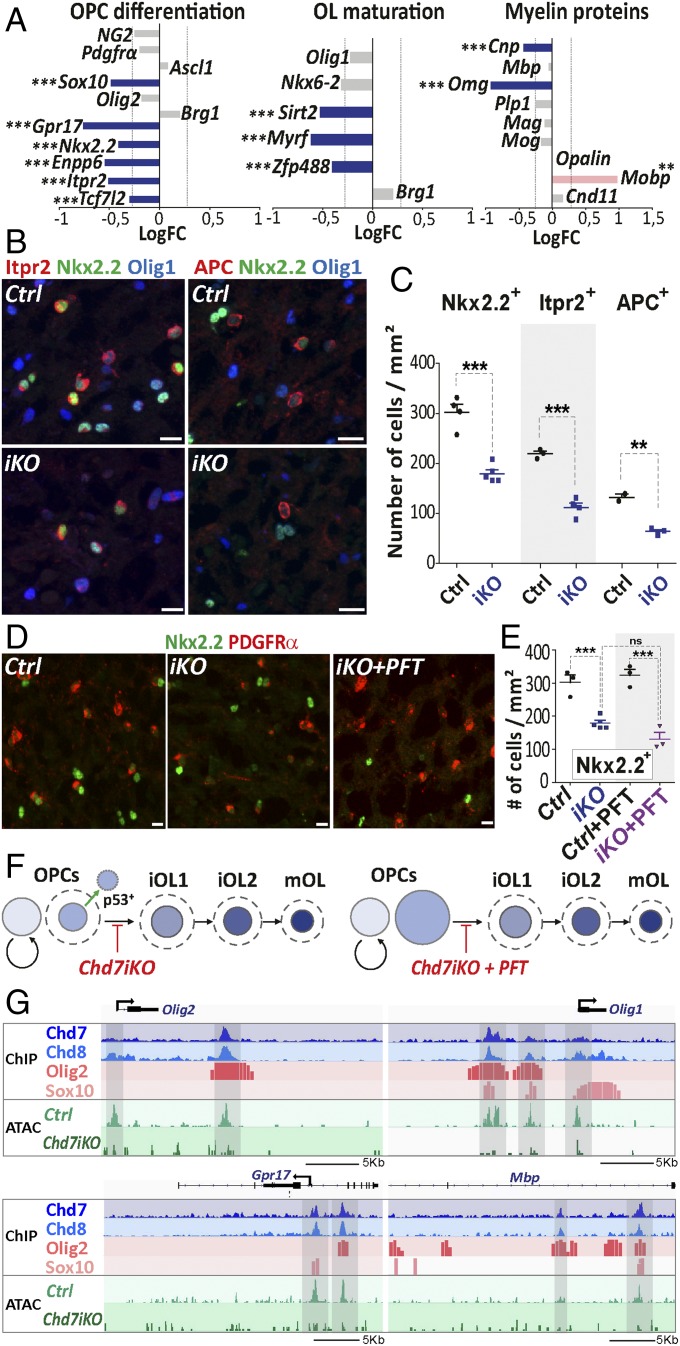
Chd7 promotes the expression of genes involved in OPC differentiation and maturation. (A) Barplot of the LogFC of genes involved in OPC differentiation, OL maturation, or coding for myelin proteins between P7Chd7iKO (iKO) and Ctrl. The dashed gray line represents fold-change = 1.2 (n = 7 Ctrl and 5 iKO). (B) Immunostaining of Itpr2 and APC together with Nkx2.2 and Olig1 in the CC from P7 control (Ctrl) and iKO (iKO) mice. (Scale bars, 10 μm.) (C) Quantification of Nkx2.2+, Itpr2+, and APC+ cells (nb/mm2) in the CC of P7 Ctrl and iKO mice. Data are presented as mean ± SEM (n = 4 Ctrl and 5 iKO). (D) Immunostaining of PDGFRα and Nkx2.2 in the CC from P7 Ctrl, iKO, and iKO+PFT mice. (Scale bars, 10 μm.) (E) Quantification of Nkx2.2+ cells (nb/mm2) in the CC of P7 Ctrl, iKO, Ctrl+PFT and iKO+PFT mice. Data are presented as mean ± SEM (n = 3 Ctrl, 5 iKO, 3 Ctrl+PFT and 3 iKO+PFT). (F) Summary representation of OL cell lineage progression in P7 iKO and iKO+PFT, mice. Circle size is proportional to the size of OL lineage cell-type population, as quantified in the CC. Dotted lines: OL population size in Ctrl. (G) Representative tracks for Olig1, Olig2, Gpr17, and Mbp locus integrating: (i) ChIP data for main oligodendroglial TFs (Olig2 and Sox10) and chromatin remodeling factors (Chd7, Chd8) in OPCs and; (ii) ATAC data from Ctrl and iKO P7 OPCs. Exact P values can be found in Dataset S2. *P < 0.05, **P < 0.01, and ***P < 0.001.

