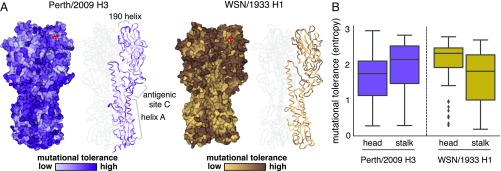
Fig. 3.
Mutational tolerance of each site in H3 and H1 HAs. (A) Mutational tolerance as measured in the current study is mapped onto the structure of the H3 trimer [Protein Data Bank (PDB) ID code 4O5N (41)]. Mutational tolerance of the WSN/1933 H1 HA as measured in ref. 10 is mapped onto the structure of the H1 trimer [PDB ID code 1RVX (42)]. Different color scales are used because measurements are comparable among sites within the same HA but not necessarily across HAs. Both trimers are shown in the same orientation. For each HA, the structure at Left shows a surface representation of the full trimer, while the structure at Right shows a ribbon representation of just one monomer. The sialic acid receptor is shown in red sticks. (B) The mutational tolerance of solvent-exposed residues in the head and stalk domains of the Perth/2009 H3 HA (purple) and WSN/1933 H1 HA (gold). Residues falling in between the two cysteines at sites 52 and 277 were defined as belonging to the head domain, while all other residues were defined as the stalk domain. A residue was classified as solvent exposed if its relative solvent accessibility was 0.2. The results are robust to the choice of solvent accessibility cutoff (see SI Appendix, Fig. S7). Note that the mutational tolerance values are not comparable between the two HAs but are comparable between domains of the same HA.

