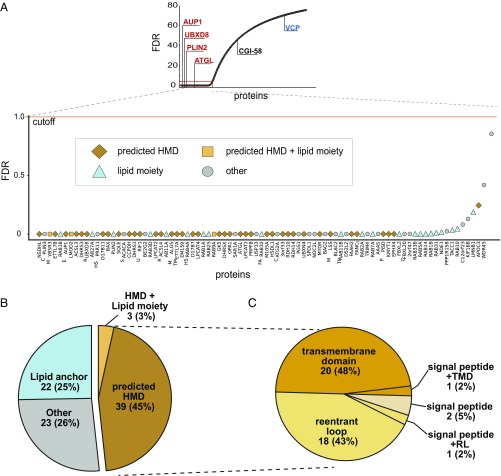
Fig. 2.
Bioinformatics analysis of candidate MIPs. (A) Proteins that fall below 1% FDR cut-off are candidate MIPs. The 87 proteins below 1% FDR are classified into one of four indicated groups that describe features that confer chaotrope-resistance. Classifications are based on annotations from Uniprot consortium and SPOCTOPUS (Dataset S1). (B) Pie chart representing proportions of MIPs classified as having lipid anchors, predicted HMDs, a combination of both, or neither (other). (C) Pie chart representing proportions of HMD-containing MIPs classified as TMD, reentrant loops (RL), signal peptides, or a combination of signal peptides with TMDs or RLs. SPOCTOPUS was used to distinguish between TMDs, RLs, and signal peptides.

