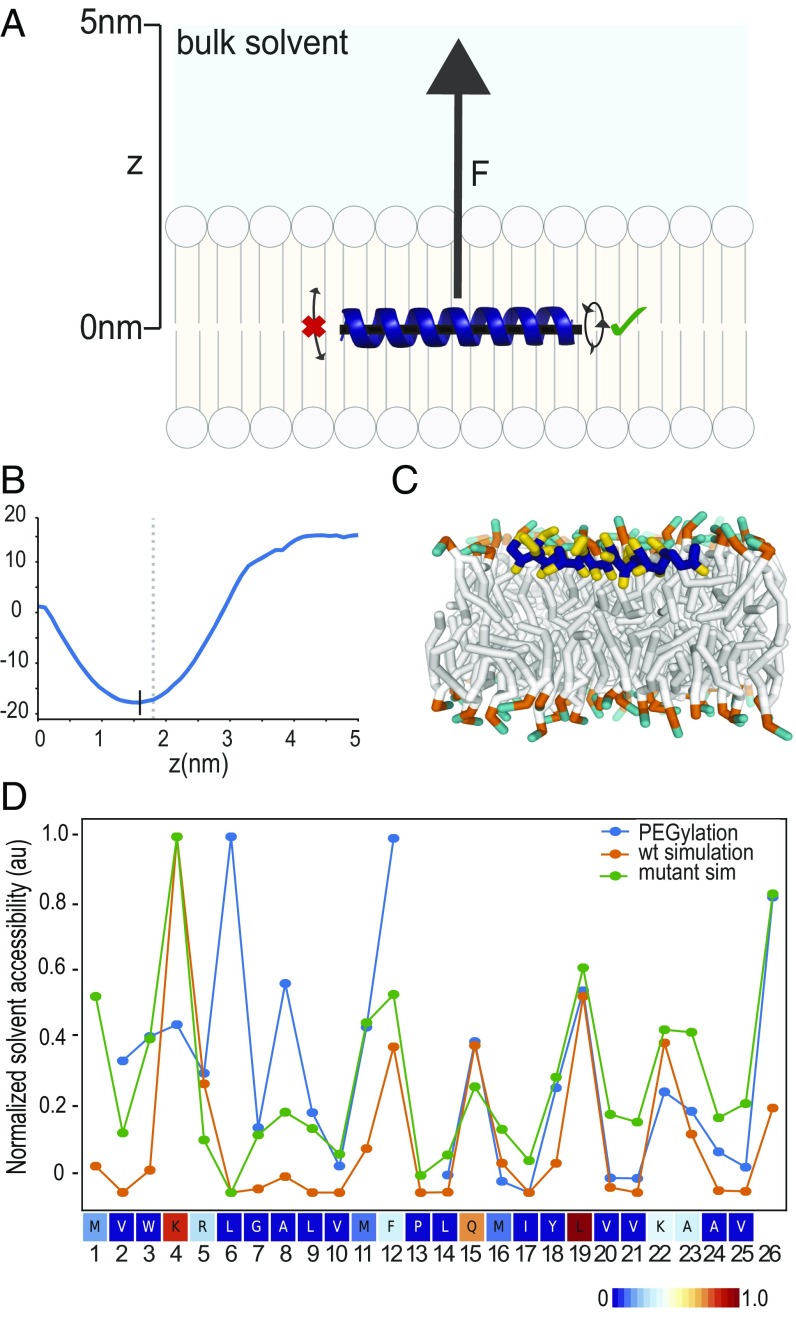
Fig. 5.
MD simulations predict DHRS3 N terminus to be at membrane-solvent interface. (A) Schematic of the steered simulation for calculating the PMF of a peptide at various depths of a bilayer membrane. An α-helical peptide was placed in the middle of a bilayer membrane and a force (F) applied in the positive (Z) direction. During the simulation, the peptide was not allowed to tilt, but was allowed to rotate. (B) Graph of the PMF measurements for DHRS3(1–26) as it is pulled from the middle of the membrane toward bulk solvent. The black vertical line denotes the minimum PMF force, and thus, the most stable location of the peptide in the membrane. The gray vertical dashed line denotes the top of the membrane. (C) Cross-sectional view of DHRS3(1–26) during an unrestrained simulation in the membrane at the location indicated by the black vertical line in B. (D) Side-chain solvent accessibility measurements from MD simulations corroborate solvent accessibility measurements from biochemical assay. DHRS3(1–26) wild-type and individual cysteine mutants were placed in the membrane position corresponding to the PMF minimum in B and allowed to run without any restraints. The calculated accessibilities of each amino acid in wild-type and individual cysteine mutants are shown in a line plot together with data from the PEGylation experiment (Fig. 4A), normalized to values between 0 and 1. Calculated accessibilities of wild-type DHRS3(1–25) is also rendered as a heatmap.

