Fig. 2.
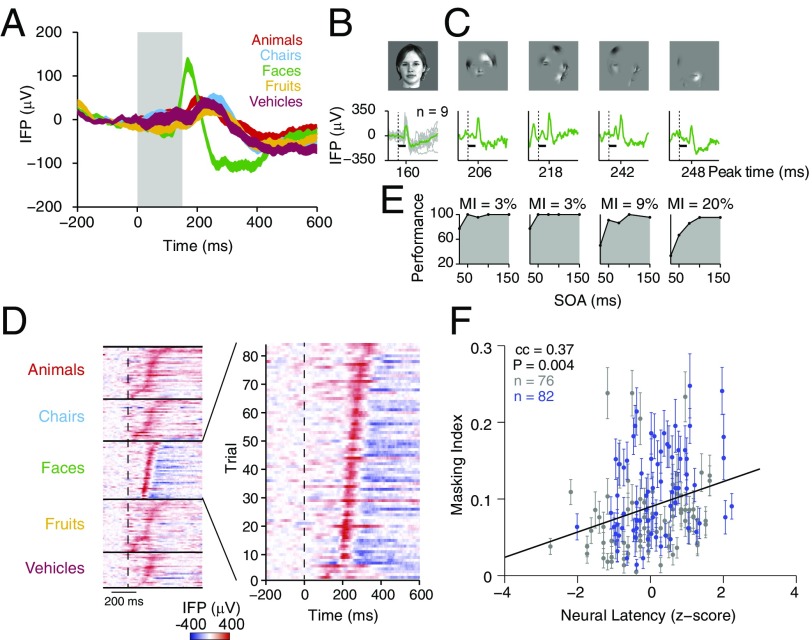
Behavioral effect of masking correlated with the neural response latency on an image-by-image basis. (A) Intracranial field potential (IFP) responses from an electrode in the left fusiform gyrus averaged across five categories of whole objects while a subject was performing the task described in Fig. 1 (no masking, 150-ms presentation time). This electrode showed a stronger response to faces (green). The gray rectangle indicates the stimulus presentation time (150 ms). The shaded area indicates SEM (details are provided in ref. 13). (B) IFP responses for one of the whole objects for the electrode in A showing single-trial responses (gray, n = 9) and average response (green). The latency of the peak response is marked on the x axis. (C) Single-trial responses (n = 1) to four partial images of the same object in B. (D) New stimulus set for psychophysics experiments was constructed from the images in 650 trials from two electrodes in the physiology experiments. A raster of the neural responses for the example electrode in A, one trial per line, from partial image trials selected for psychophysics is shown. These trials elicited strong physiological responses with a wide distribution of response latencies (sorted by the neural latency). The color indicates the voltage (color scale on bottom). (Right, Inset) Zoomed-in view of the responses to the 82 trials in the preferred category. (E) We measured the effect of backward masking at various SOAs for each of the same partial exemplar images used in the physiology experiment (n = 33 subjects) and computed an MI for each image (Methods). The larger the MI for a given image, the stronger was the effect of masking. (F) Correlation between the effect of backward masking (y axis, MI as defined in E) and the neural response latency (x axis, as defined in B and C). Each dot is a single partial object from the preferred category for electrode 1 (blue) or 2 (gray). Error bars for the MI are based on half-split reliability (SI Appendix, Fig. S2), and the neural latency values are based on single trials. There was a significant correlation (Pearson r = 0.37; P = 0.004, linear regression, permutation test). cc, correlation coefficient.

