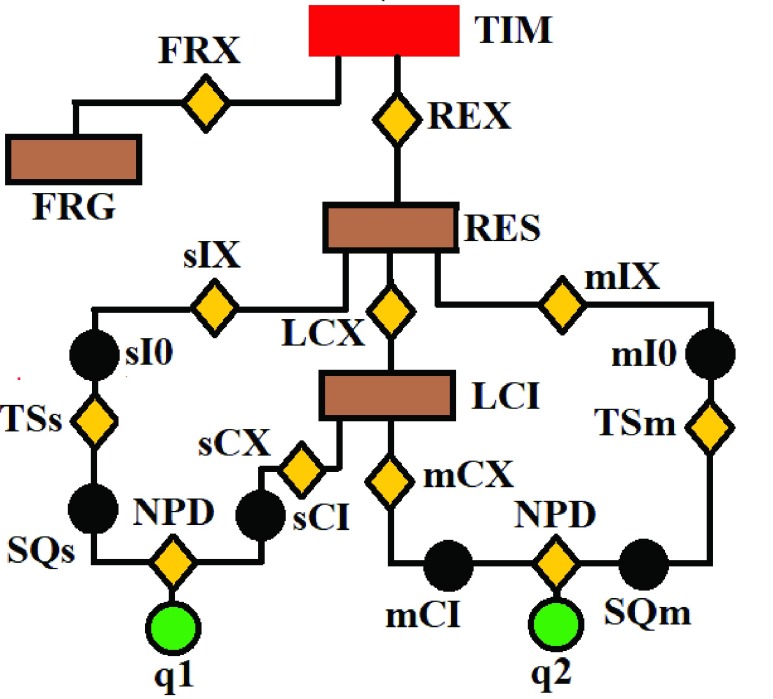
FIGURE 1.
The flow chart of our proposed no-reference quality evaluation for MRI images. The first step rescale REX the intensity level of the test image TIM to lie between 0 and 1, followed by the extraction FRX of foreground FRG. The third step computes (mIX, sIX) the first mI0 and second sI0 moments of the test image. The local contrast feature image LCI is extracted LCX in the fourth step. The fifth step computes (mCX, sCX) the first mCX and second sCX moments of the local contrast feature image. The lightness contrast quality score q1 and the texture contrast quality score q2 are computed in the sixth and seventh steps from the cumulative normal distribution function NPD of the random variables evaluated at ( ,
,  ). In the last step, the total quality score is computed from the weighted sum of the lightness and contrast quality scores.

