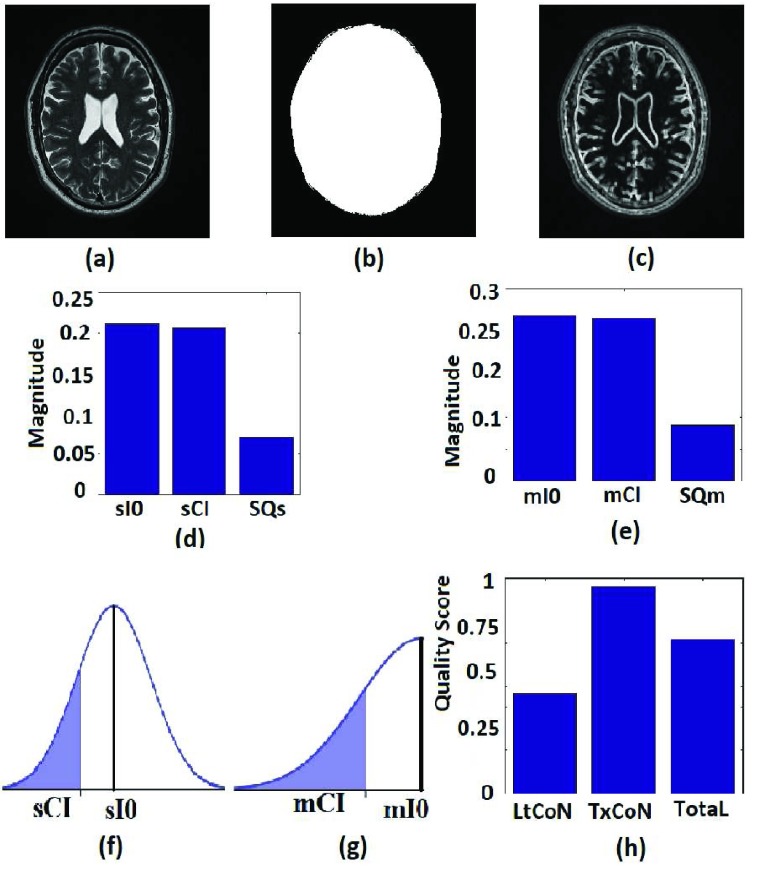
FIGURE 2.
Description of the proposed no-reference quality evaluation for MRI images. (a) The test image has its pixel intensity level rescaled to lie between 0 and 1. (b) Foreground of the test image in (a) is extracted. (c) Local contrast feature image is extracted from the test image. (d) The second moments (sI0, sCI) is computed from the test image and the local contrast feature image. The variance SQs of the normal distribution is also computed. (e) The first moments (mI0, mCI) computed from the test image and the local contrast feature image as well as the variance SQm of the normal distribution. (f) Two-tail cumulative distribution function for the computation of lightness contrast quality score. (g) One-tail cumulative distribution function for the computation of texture contrast quality score. (h) Bar chart of the lightness contrast quality score, texture contrast quality score and the total quality score.

