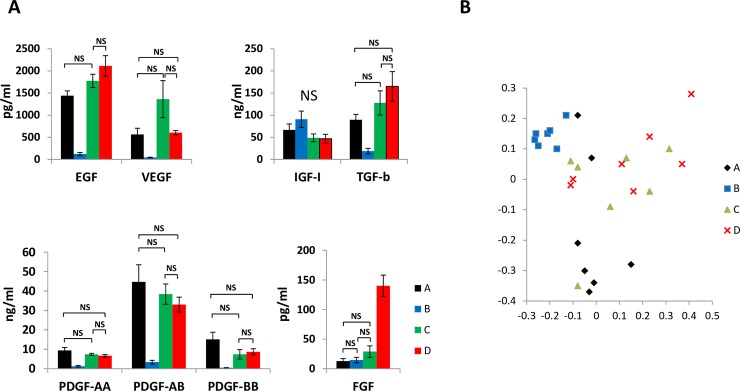
Fig 2. Analysis of growth factor concentration in different medium additives.
(A) Concentrations of selected growth factors measured in samples of the four medium additives A (recalcified PRP) and B (recalcified PPP), C (freeze and thaw, plasma depleted platelets) and D (freeze and thaw, PRP). Statistical analysis was performed by one-way ANOVA for independent samples and Tukey’s honestly different significance and Bonferroni’s correction was chosen as post hoc test. Not significant (NS) differences were graphically indicated by solid lines in the different graphs. Concentration values analyzed within each growth factor displayed statistically significant (p<0.05) differences only when not connected by solid lines. (B) Graphical representation of PCA performed on concentration values of all growth factors evaluated in single donor samples of the different medium additives. Exception made for medium additive A, samples of the other medium additives could not be segregated in separate clusters.

