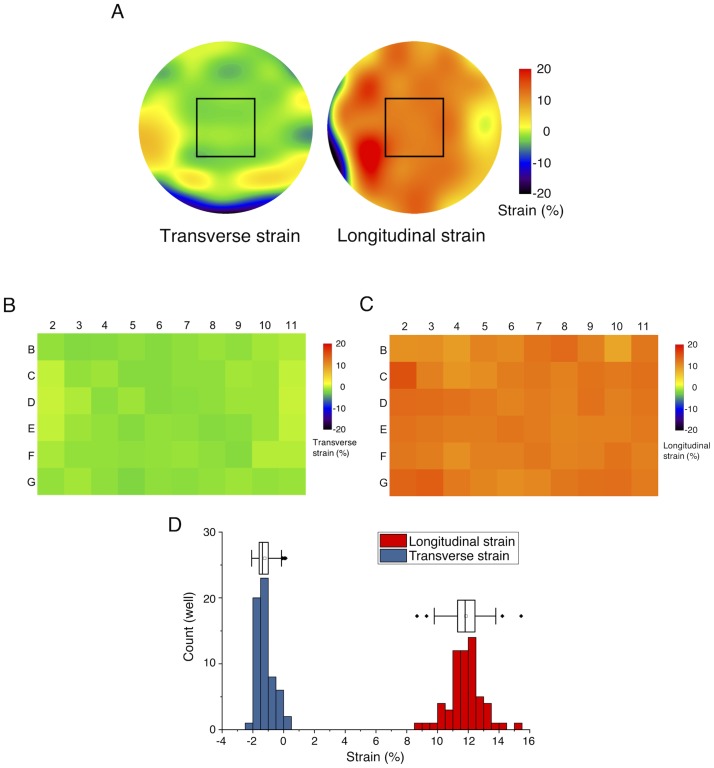
Fig 5. Elastic image registration to evaluate local strain distributions within individual wells.
(A) Representative data of local strain distributions within a well under macroscopic 7% stretch exerted on the shorter plate edges. Rectangular regions were analyzed for the subsequent B—D and imaged for cell experiments. (B) Map of transverse strains. (C) Map of longitudinal strains. (D) Frequency distribution of the magnitude of the strains. Boxes represent the 25th and 75th percentiles and the median. Open squares indicate means. Whiskers extend from the ends of the box to the most remote points excluding outliers.

