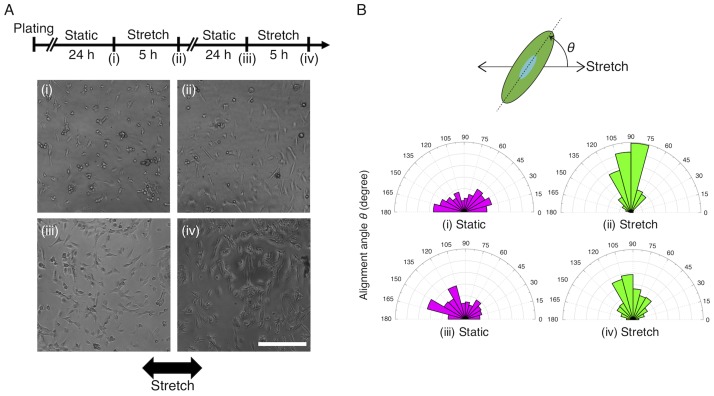
Fig 6. Long-term cell culture test demonstrates repeatable adaptive response of cells to cyclic uniaxial stretch.
(A) Experimental time course and representative cell images. Black arrow represents the direction of the stretch. Scale bar, 300 μm. (B) Wind rose histograms of the cell alignment angle at the time points (i)–(iv) shown in A. The number of cells; (i) n = 226, (ii) n = 232, (iii) n = 211, and (iv) n = 311.

