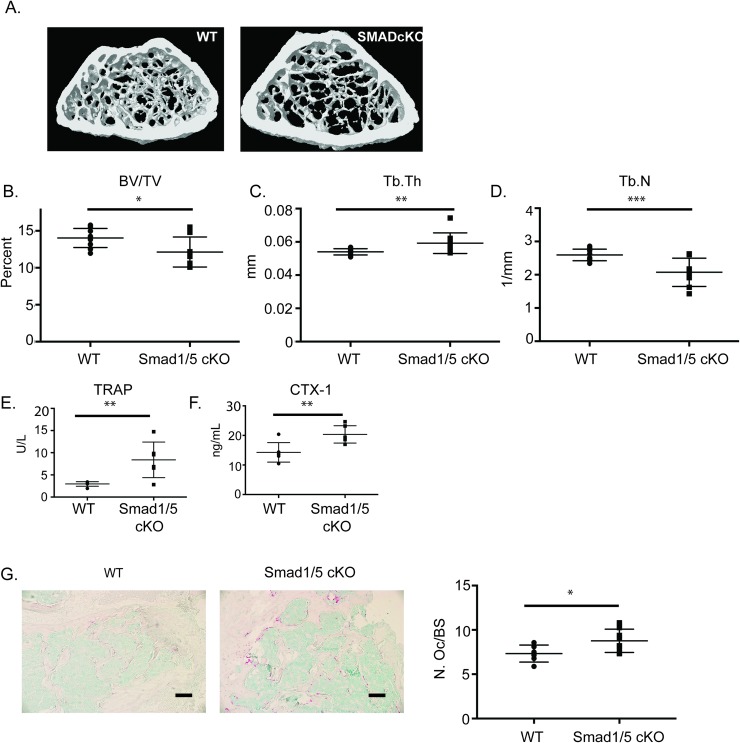
Fig 2. Micro CT analysis of SMAD1/5 cKO mice shows minimal change in trabecular bone.
Three-month-old male Smad1fl/fl/Smad5flfl;Cfms-Cre and WT mice were analyzed by micro-CT. (A) Representative μCT scans of distal femur from WT and Smad1fl/fl/Smad5fl/fl;Cfms Cre mice at 3 months of age. (B) Comparison of bone volume/ total volume (C), trabecular thickness (D) and trabecular number. (E) TRAP ELISA (F) CTX ELISA and (G) histological images and analysis of TRAP stained sections of trabecular bone. Data represent the mean values of 13 WT, 8 KO. Scale bar 200 μm. Samples were compared using T-test * p<0.05 vs. respective WT. ** p<0.01 vs. WT, *** p<0.001 vs. WT.

