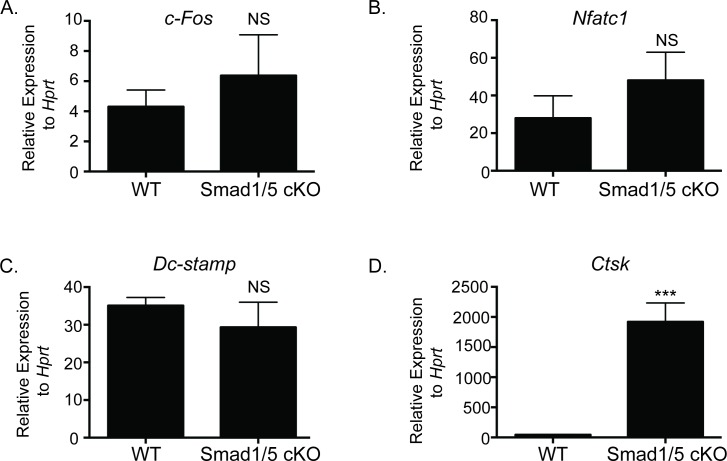
Fig 4. Gene expression of SMAD1/5 cKO and WT osteoclast cultures.
qRT-PCR comparing expression of osteoclast genes from WT and SMAD1/5 cKO mice after 3 days of RANKL treatment. (A) c-Fos, (B) Nfatc1, (C) Dcstamp, and (D) Ctsk. Data shown are the mean ± SD of three independent experiments in which gene expression was measured from three wells of each genotype, with each PCR reaction performed in duplicate. Expression of each gene is graphed relative to Hprt. Samples were compared using T-test *** p<0.001 vs. WT.

