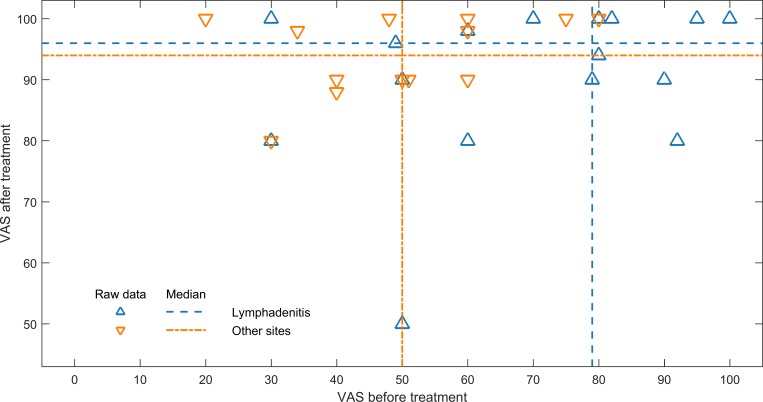
Fig 2. Scatterplot showing the EQ visual analogue scale scores before and after TB treatment.
The scores are divided according to the site of TB infection, where the TB lymphadenitis patients are indicated with blue colour and other sites of TB infection with orange colour. The median scores in both groups before and after treatment are shown. Both groups reported significantly higher self-rated health after treatment.

