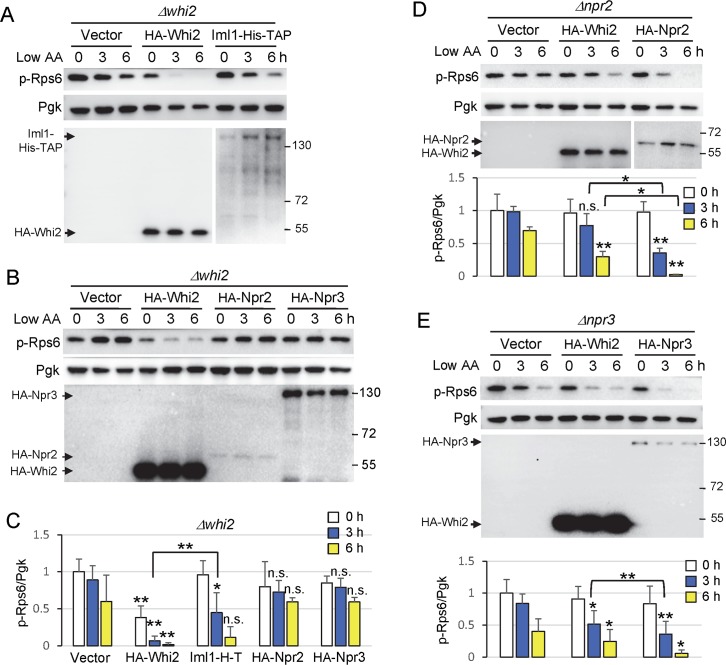
Fig 4. Whi2 functions parallel to the Iml1-Npr2-Npr3 complex in low amino acids.
(A-B) Immunoblot analysis for TORC1 activity assessed with anti-phospho-RpsS6 in Δwhi2 expressing the indicated proteins (second line) before and after amino acid reduction (switch from SCCSH to SCME). Anti-HA was used to detect N-terminal HA-tagged Whi2, Npr2, and Npr3 expressed from the PGK1 promoter, and anti-His was used to detect C-terminal His-TAP-tagged Iml1 expressed from the constitutive ADH1 promoter. For reproduction, contrast-adjusted images are shown for HA blots in panel B. Equal loading was achieved primarily by optical density-matched cultures and monitored with anti-Pgk. (C) Quantification of TORC1 activity (the ratio of phospho-Rps6/Pgk) from A-B. Values were normalized to the average value of empty vector at time zero, and presented in the bar graph as means ± SD (n = 3–6 independent experiments). **P < 0.01; *P < 0.05; n.s., not significant, compared to the respective vector control using a two-tailed T test. (D-E) Immunoblot analysis for TORC1 activity in Δnpr2 and Δnpr3 expressing the indicated proteins (second line) as described in A-B. A longer exposure of the same blot is shown for HA-Npr2 in D. Corresponding bars below show quantification of TORC1 activity as described in C. n = 3 (in D) and n = 4 (in E) independent experiments. **P < 0.01; *P < 0.05; n.s., not significant, compared to the respective vector control using a two-tailed T test.

