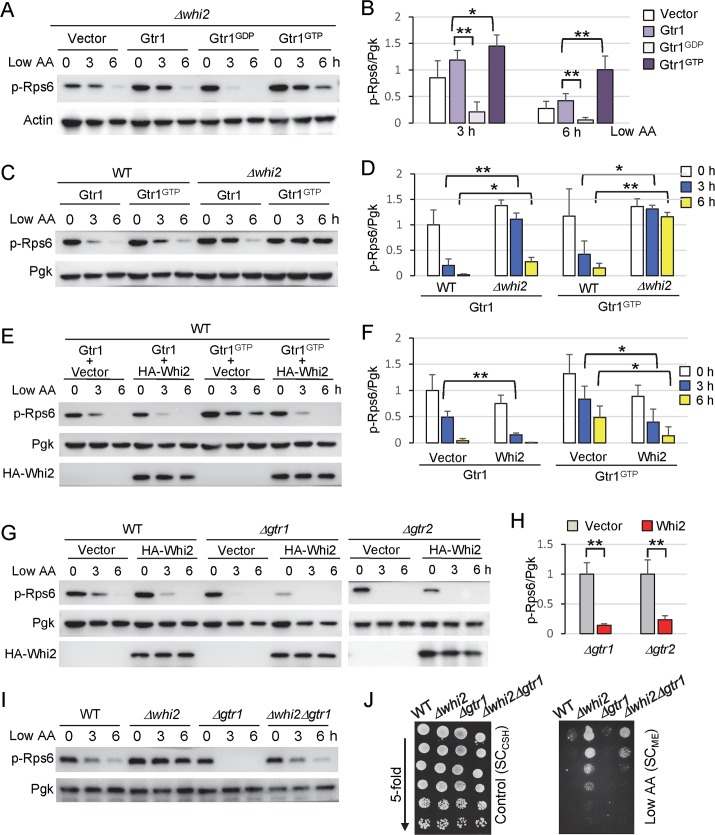
Fig 5. Whi2 modulates TORC1 activity independently of Gtr complex.
(A, C, E, G, I) Assessment of TORC1 activity by anti-phospho-Rps6 immunoblot analysis of the indicated yeast strains at increasing times after switching from control/high SCCSH to low amino acid SCME media as described in Fig 1G. Representative of >3 independent experiments is shown. (B) Quantification of TORC1 activity (ratio of phospho-Rps6/Pgk) from panel A at 3 h and 6 h after switching from control/high SCCSH to low amino acid SCME media. Values were normalized to the average value of empty vector at time zero, and presented as means ± SD (n = 4 independent experiments). p = 6.1 x 10⁻⁵ (3h), p = 0.0073 (6h) between Gtr1 and Gtr1GDP. p = 0.023 (3h), p = 0.0062 (6h) between Gtr1 and Gtr1GTP using paired two-tailed t-test. (D) Quantification of TORC1 activity (ratio of phospho-Rps6/Pgk) from panel C. Values were normalized to the average value of WT expressing wild type Gtr1 at time zero, and presented as means ± SD (n = 3 independent experiments). p = 7.6 x 10⁻⁴ (3h), p = 0.038 (6h) between WT and Δwhi2 expressing wild type Gtr1. p = 0.037 (3h), p = 0.0077 (6h) between WT and Δwhi2 expressing Gtr1 GTP using paired two-tailed t-test. (F) Quantification of TORC1 activity (ratio of phospho-Rps6/Pgk) from panel E. Values were normalized to the average value of WT containing wild type Gtr1 + empty vector at time zero, and presented as means ± SD (n = 4 independent experiments). p = 0.0015 (3h) between vector and Whi2 co-expressed with wild type Gtr1. p = 0.018 (3h), p = 0.017(6h) between vector and Whi2 co-expressed with Gtr1 GTP using paired two-tailed t-test. (H) Quantification of TORC1 activity (the ratio of phospho-Rps6/Pgk) of Δgtr1 and Δgtr2 from G at time zero. Values were normalized to the average value of Δgtr1 or Δgtr2 containing empty vector, and presented in the bar graph as means ± SD (n = 4 independent experiments). p = 0.00014 between vector and Whi2 in Δgtr1. p = 0.0013 between vector and Whi2 in Δgtr2 using paired two-tailed t-test. For B, D, F and H, **P < 0.01; *P < 0.05. No data were included in >1 graph. (J) Growth of indicated yeast strains spotted in parallel in 5-fold serial dilutions on both control/high (SCCSH) and low amino acid plates (SCME). Representative of 3 independent experiments is shown.

