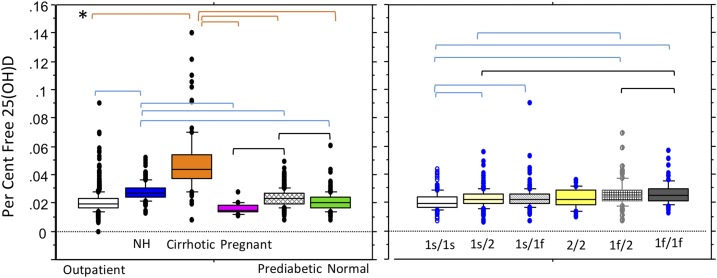
Figure 2.
Percentage free 25(OH)D concentrations are presented by clinical subgroup (left) and by DBP haplotypes (right) (subset of n = 974). The box plot shows the 10th, 25th, median, 75th, and 90th percentile values. Individual points represent values above the 90th and below the 10th percentiles. Both clinical subgroup and DBP genotype had significant effects on percentage free 25(OH)D (ANOVA, P < 0.0001). *Horizontal brackets indicate statistically significant post hoc between-group comparisons (meeting Bonferroni criteria of P < 0.0033). Post hoc between-group comparisons were significant for all but healthy persons compared with pregnant women or outpatients, or for pregnant women compared with outpatients. For DBP haplotypes, smaller but significant differences were detected between the 1s/1s haplotype and the 1s/1f, 1f/2, 1f/1f, and 1s/2 haplotypes and between the 1s/2 and 1f/2 and 1f/1f haplotypes and between the 1s/1f and 1f/1f haplotypes. NH, nursing home.

