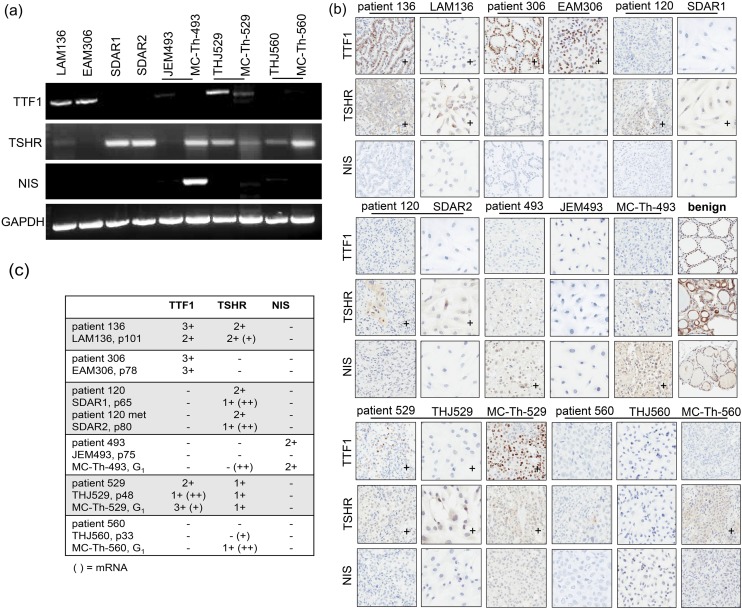
Figure 2.
Thyroid marker analysis and comparison. (a) RT-PCR of TTF1, TSHR, NIS, and GAPDH loading control in thyroid cell lines and PDTX models. (b) IHC of TTF1, TSHR, and NIS in thyroid patients along with corresponding cell lines and PDTX models. Benign thyroid tissue was used as a positive control. IHC images were obtained at original magnification ×20 using an Aperio AT2 Scanscope. + indicated at least 20% positive signal intensity as described in “Materials and Methods.” (c) Summary of thyroid marker mRNA and protein expression (n = 3). IHC expression was scored as either weak (1+), moderate (2+), or strong (3+) with criteria of at least 20% positivity [mRNA when data deviated from protein expression and were categorized as either weak (+) or moderate–strong (++)]. Passage and generation numbers of the models are as indicated.

