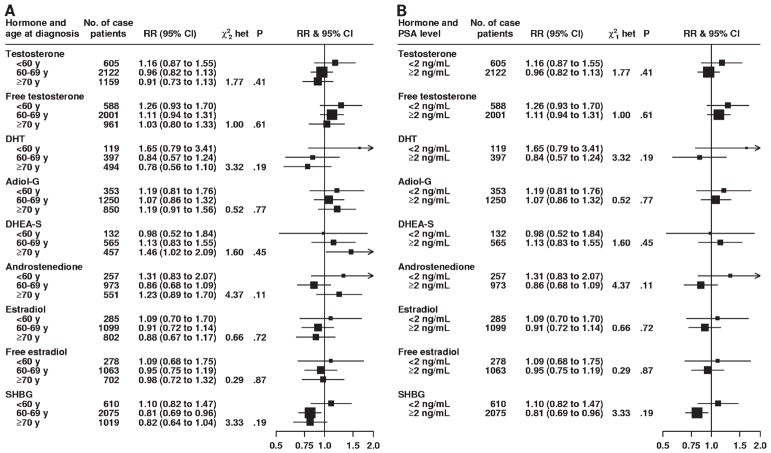
Fig. 4.
Association between risk of prostate cancer and sex hormone concentrations according to age at diagnosis (A) and prostate-specific antigen level at recruitment (B). The relative risk is the estimate of the linear trend for each sex hormone obtained by replacing the categorical variables representing the fifths with a continuous variable scored as 0, 0.25, 0.5, 0.75, and 1. The position of each square indicates the magnitude of the relative risk, and the area of the square is proportional to the amount of statistical information available (inverse of the variance of the logarithm of the relative risk). The length of the horizontal line through the square indicates the 95% confidence interval. The chi-square statistic for heterogeneity ( and het) is to assess whether the relative risk estimates for each characteristic are different from each other. The P value was two-sided for statistical significance of the chi-square heterogeneity statistic. RR = relative risk; CI = confidence interval; DHT = dihydrotestosterone; Adiol-G = androstanediol glucuronide; DHEA-S = dehydroepiandrosterone sulfate; SHBG = sex hormone–binding globulin.

