
Figure 1.
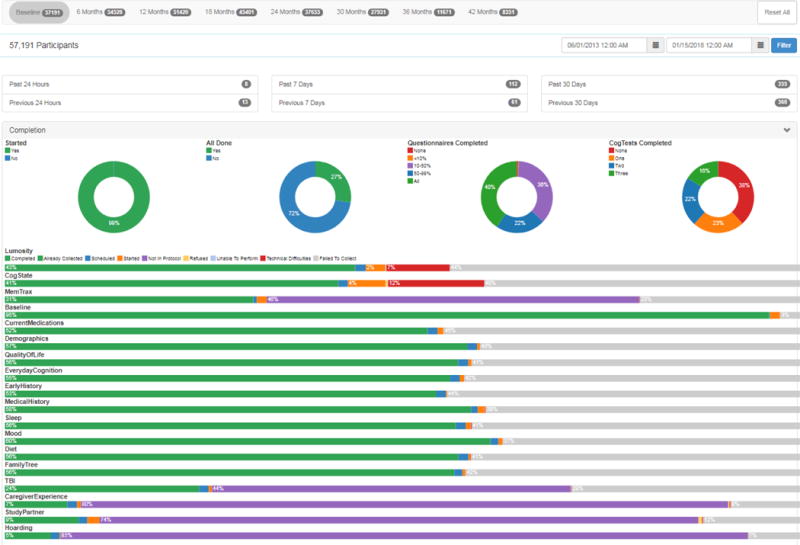
Example of a BHR dashboard. The BHR dashboard offers up-to-date information to the BHR research team. The top navigation bar allows switching between baseline and follow-up visits. Total numbers of consented participants and subtotals of participants enrolled in the previous day/week/month are represented by the circles beneath. Completion of online questionnaires and cognitive tests are tracked bars at the bottom, and these are also available on an individual level. Also available, but not depicted in this figure, are demographic information and referral sources.