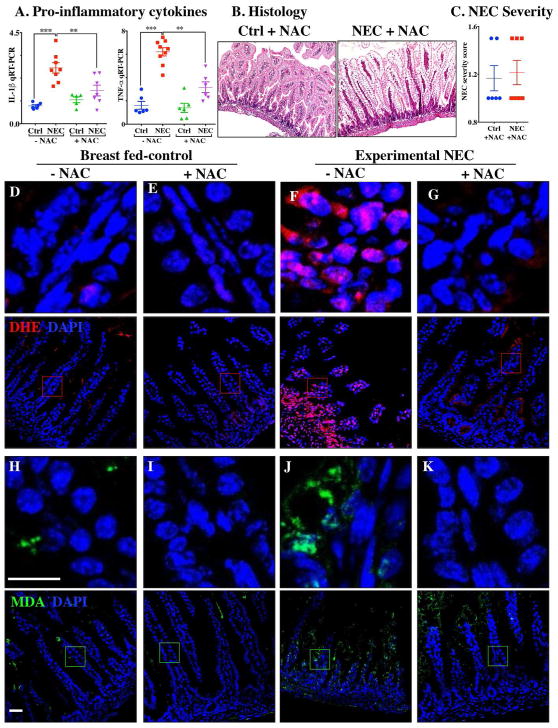
Figure 7. Administration of the ROS scavenger N-acetylcysteine (NAC) prevents ROS generation and NEC development.
A: qRT-PCR of pro-inflammatory cytokines; B: H&E stained images; C: NEC severity score; D–G: Immunofluorescence images of Dihydroxyethidium (DHE-red) and DAPI stained (nuclei, blue); H–K: Immunofluorescence images of malondialdehyde (MDA-green) and DAPI stained (nuclei, blue) from distal intestine (ileum) of control and NEC mice (Ctrl, Control-Breast fed or experimental NEC treatments with and without N-acetylcysteine supplementation). **p<0.01, ***p<0.001 by a Student t test when comparisons of two groups were made, and by ANOVA for multiple comparisons, each dot represents data from individual mouse, scale bar =10μm.

