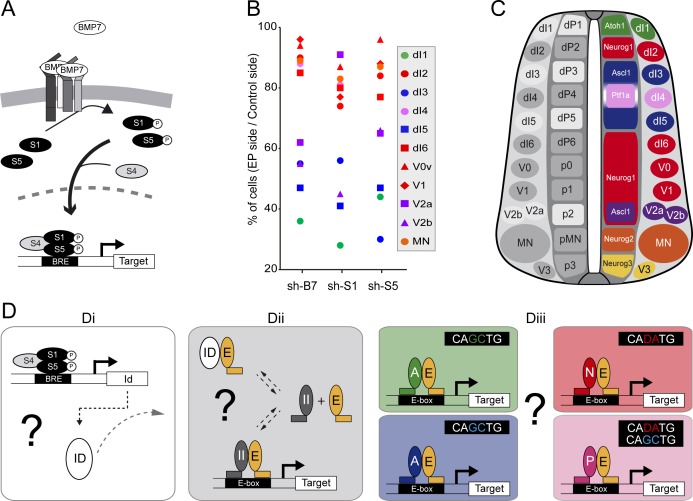
Figure 1. The canonical BMP pathway differentially regulates the generation of spinal neurons derived from progenitors that express ASCL1/ATOH1 or NEUROG1/NEUROG2/PTF1a.
(A) Actors of the canonical BMP pathway (BMP7, SMAD1 and SMAD5) known to regulate spinal neurogenesis. (B) Dot-plot representing the spinal neuronal subtypes generated 48 hpe with plasmids producing sh-RNA targeting cBmp7 (sh-B7), cSmad1 (sh-S1) or cSmad5 (sh-S5), comparing the electroporated side to the contra-lateral side. The colour code corresponds to the proneural proteins expressed in the corresponding progenitor domains, as shown in C. (C) Drawing of a transverse section of the developing spinal cord at mid-neurogenesis, highlighting: (left) the neuronal subtypes strongly (white) or moderately (grey) affected by inhibiting canonical BMP activity, and (right) a colour-coded representation of the proneural proteins expressed in the corresponding progenitor domains. (D) Working hypothesis whereby we propose to test if (i) the canonical BMP activity is mediated by ID proteins; (ii) ID proteins act by sequestering E proteins (E, orange), thereby inhibiting the activity of class II HLH/proneural proteins (II, grey); and (iii) E proteins co-operate equally or differentially with the distinct proneural proteins as a function of their preferential binding to specific E-box sequences. .


