. 2018 Sep 6;7:e36187. doi: 10.7554/eLife.36187

Figure 1. RNA-seq reveals inter-tissue EC heterogeneity.

(A) Genome browser images showing CG methylation (top) and RNA expression (bottom) for two genes: Slc2a1, a glucose transporter expressed in brain ECs, and Fabp4, a fatty acid binding protein expressed in liver and kidney ECs. For DNA methylation, the mCG/CG ratio is shown, with the height of each bar indicating the fractional methylation (range: 0 to 1). For RNA-seq, histograms of the number of aligned reads are shown. For this and all other genome browser images, the heights of all the tracks of a given sequencing experiment are the same across samples. For both genes, tissue-specific gene expression is associated with tissue-specific hypomethylation near the TSS. Red arrows indicate illustrative examples of differential hypomethylation. Br, brain; Li, liver; Lu, lung; Ki, kidney. R1 and R2, biological replicates. Black arrows beneath this and all other genome browser images indicate the direction of transcription. (B) Scatter plots comparing cross-sample normalized RNA-seq read counts of EC-expressed protein-coding genes from brain versus liver, lung, and kidney, showing only those transcripts with TPM >10 for each of the two RNA-seq replicates. Colored symbols indicate transcripts with FDR < 0.05 and enrichment >2 fold for the indicated tissue comparison. Right, comparison of cross-sample normalized RNA-seq read counts for protein-coding genes between the two brain EC replicates. Values depicted are the log2 transformation of cross-sample normalized counts + 1. (C) Heatmaps depicting transcript abundances for 739 Endothelial Cell Tissue-Specific Genes (ECTSGs). Left, log2 transformation of TPM +1. Right, z-scores for the TPMs. (D) Principal component analysis of all EC-enriched transcripts from brain, liver, lung, and kidney. The two symbols for each sample represent biological replicates. In this and all other figures, tissue type is indicated by color: Br, brain, blue; Li, liver, cyan; Lu, lung, magenta; Ki, kidney, green.

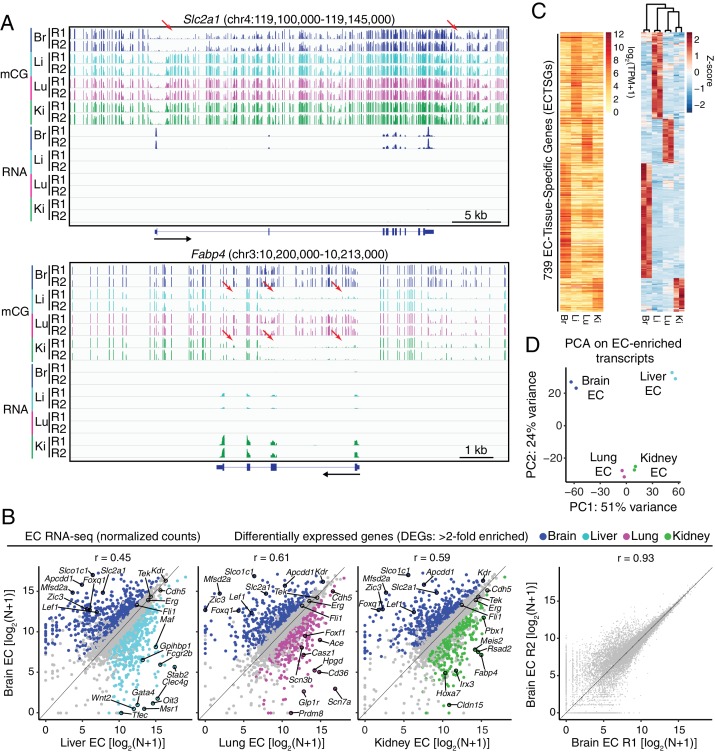
Figure 1.

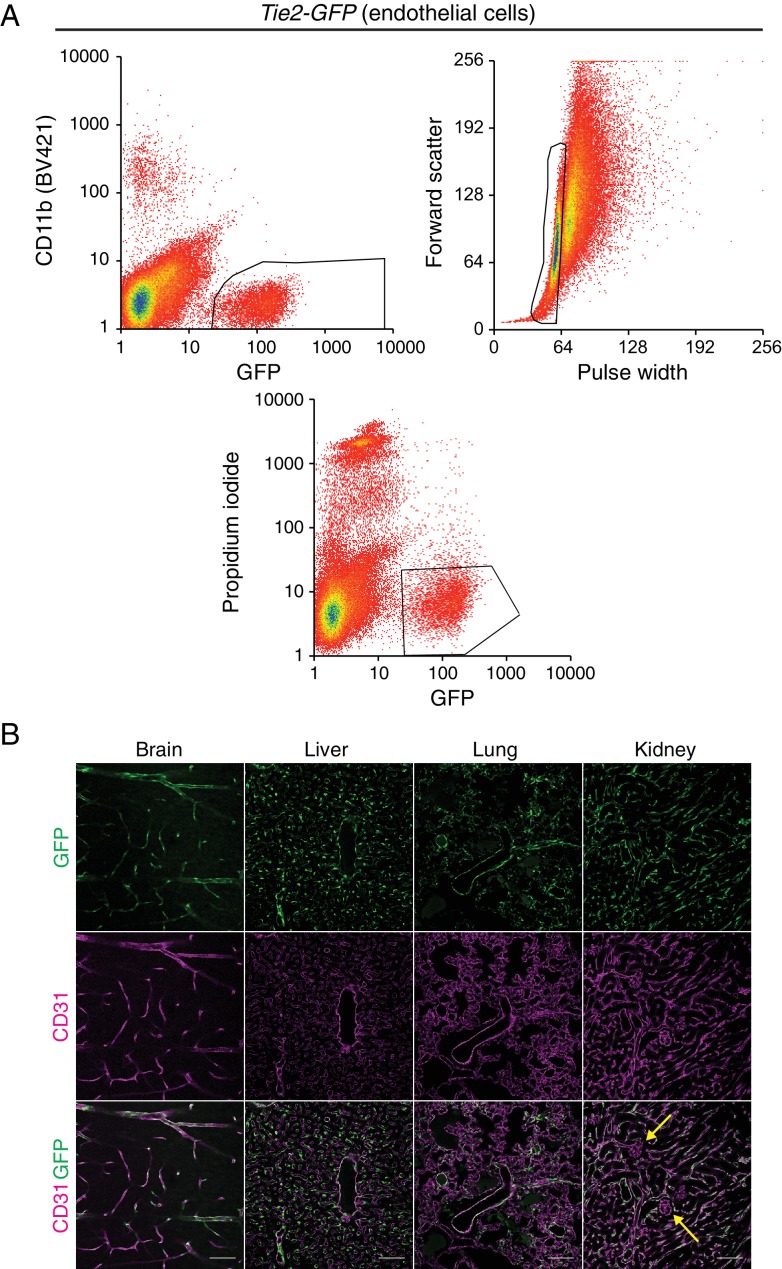
Figure 1—figure supplement 1. Tie2-GFP transgenic mouse enables isolation of ECs.

Figure 1—figure supplement 1.

(A) A representative flow cytometry profile of ECs sorted from Tie2-GFP kidneys. The thresholds used to define GFP-positive CD11b-negative ECs (top left), singlets (top right), and viable propidium iodide-negative (bottom) ECs are outlined in black. (B) Immunostaining of brain, liver, lung, and kidney from P7 Tie2-GFP mice. Anti-GFP (green) staining in the top row reveals accumulation of GFP in CD31-positive (magenta) blood vessels. Yellow arrows indicate renal glomerular capillaries, which are GFP-negative. Scale bar: 100 um.
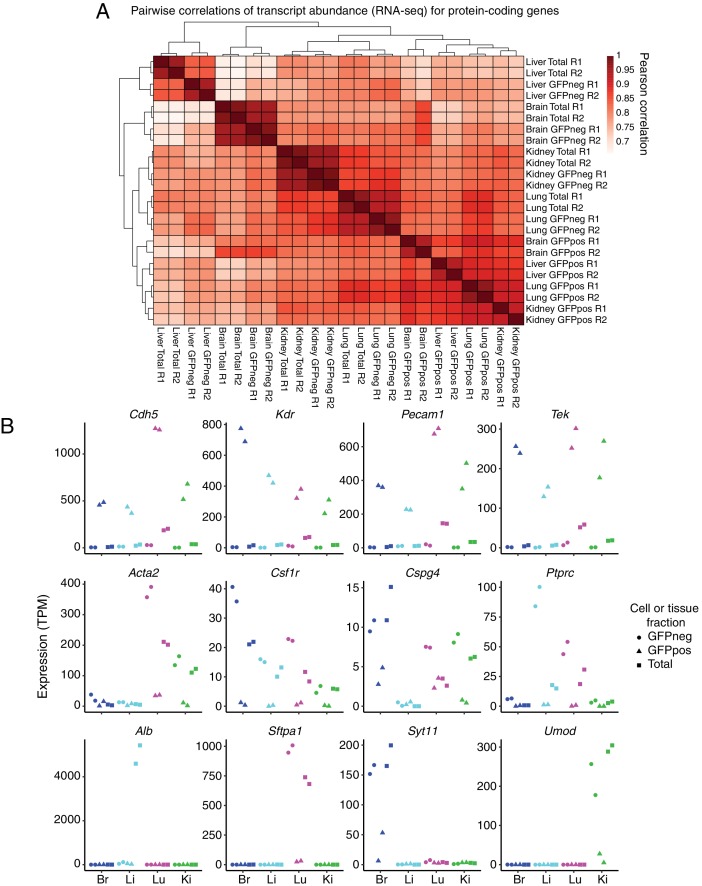
Figure 1—figure supplement 2. GFP-positive FACS-sorted cells from P7 Tie2-GFP mice represent pure populations of ECs.

Figure 1—figure supplement 2.

(A) Heatmap indicating pairwise Pearson correlations for RNA-seq TPMs for protein-coding genes. Total indicates sequencing performed on total dissociated tissue, GFPneg indicates sequencing performed on GFP-negative FACS-sorted cells, and GFPpos indicates sequencing performed on GFP-positive FACS-sorted cells. R1 and R2 indicate biological replicates. (B) Expression levels (TPMs) based on RNA-seq for the indicated genes. The top row of genes are known EC-expressed genes. EC-specific transcripts comprise ~15% of total lung transcripts. The middle row of genes are known immune or mural cell-expressed genes. The bottom row of genes are known abundant parenchymal-expressed genes. In this and subsequent figures, cell or tissue fractions are indicated by the following symbols: GFP-negative, circle; GFP-positive, triangle; Total, square. GFP-positive represents FACS-purified ECs.
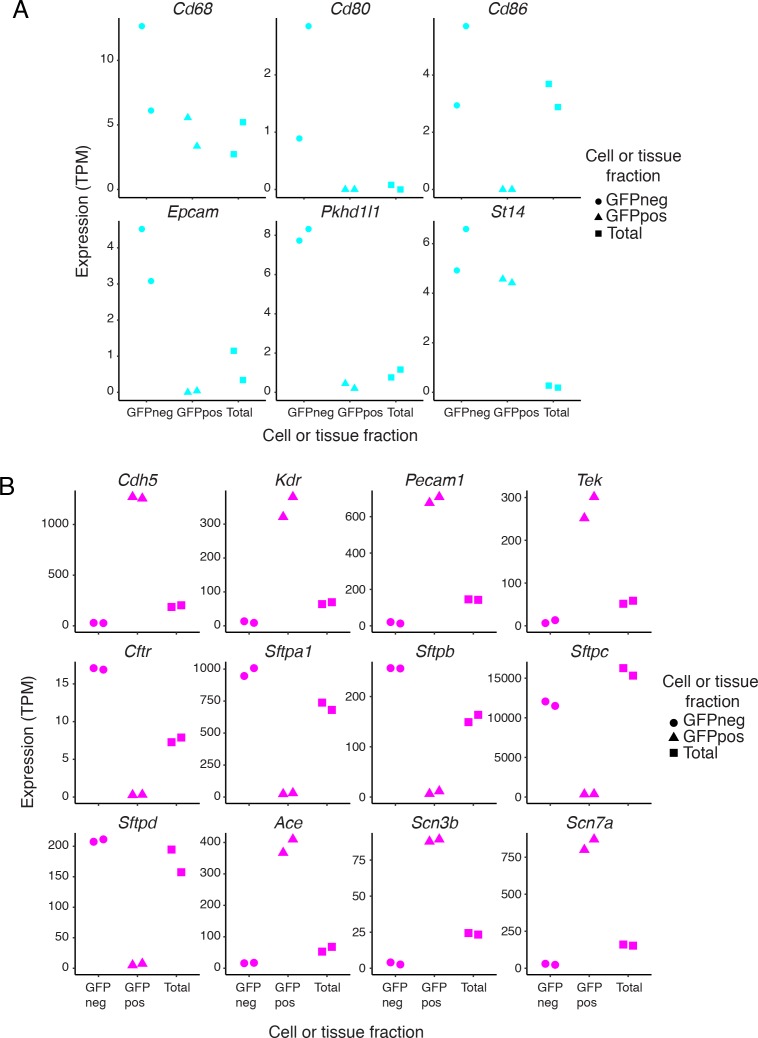
Figure 1—figure supplement 3. Expression of cell-type-specific transcripts in liver and lung samples.

Figure 1—figure supplement 3.

(A) Examples of liver gene expression to assess purity of FACS-sorted fractions. Expression levels (TPMs) based on RNA-seq for genes known to be expressed in Kupffer cells (top row) or cholangiocytes (bottom row). (B) Examples of lung gene expression to assess purity of FACS-sorted fractions. RNA-seq expression plots for genes known to be pan-EC (Cdh5, Kdr, Pecam1, and Tek), lung epithelial-specific [Cftr and genes coding for surfactant proteins (Sftp)], and lung EC-specific (Ace). Scn3b and Scn7a match the lung EC-specific expression pattern.
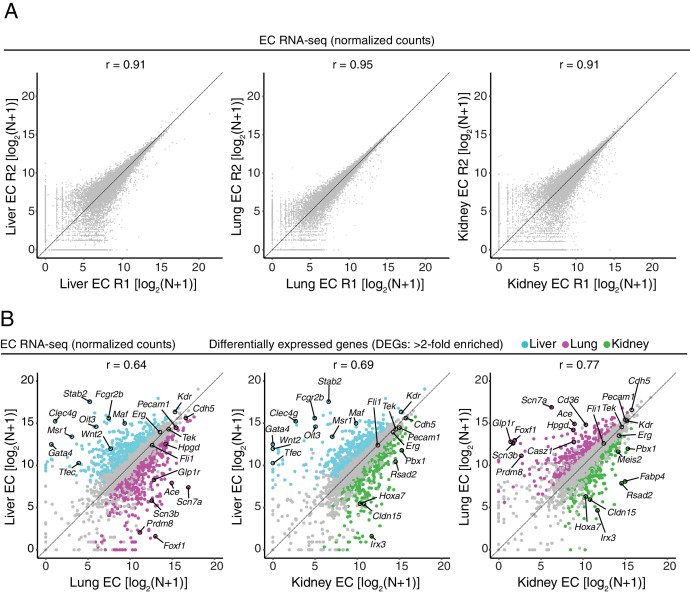
Figure 1—figure supplement 4. RNA-seq comparisons between peripheral ECs.

Figure 1—figure supplement 4.

(A) Scatter plots comparing cross-sample normalized RNA-seq read counts of protein-coding genes for pairs of biological replicates from liver ECs, lung ECs, and kidney ECs. (B) Scatter plots comparing cross-sample normalized RNA-seq read counts of EC-expressed protein-coding genes from liver versus lung, liver versus kidney, and lung versus kidney, showing only those transcripts with TPM >10 for each of the two RNA-seq replicates. Colored symbols indicate transcripts with FDR < 0.05 and enrichment >2 fold for the indicated tissue comparison. Values depicted are the log2 transformation of cross-sample normalized counts + 1.