. 2018 Sep 6;7:e36187. doi: 10.7554/eLife.36187

Figure 2. MethylC-seq reveals distinct classes of hypomethylated regions in ECs.

(A) Scatter plots comparing the mean fraction of CG methylation in a 5 kb window immediately 3’ of the TSS for protein-coding genes from brain ECs versus liver, lung, and kidney ECs. Colored symbols indicate transcripts with FDR < 0.05 and enrichment >2 fold for the indicated tissue comparison. These plots show a positive correlation between EC tissue-specific gene expression and tissue-specific hypo-methylation. Right, comparison of CG methylation between the two brain EC biological replicates. (B) Heatmap indicating the percentage of each row that overlaps with differentially expressed genes. A significant proportion of ECTS-large hypo-DMRs overlap differentially expressed genes for the same EC-subtype relative to the other EC subtypes. Black stars indicate statistical significance at q < 1×10⁻¹⁰. (C) Heatmap indicating the percentage of each row that overlaps with either ECTS-large hypo-DMRs or DMVs. DMVs exhibit more overlap between EC subtypes than large hypo-DMRs. (D) Genome browser images showing methylation as in Figure 1A at various TF genes. Colored bars indicate DMVs. Each genome browser image is at the same scale.

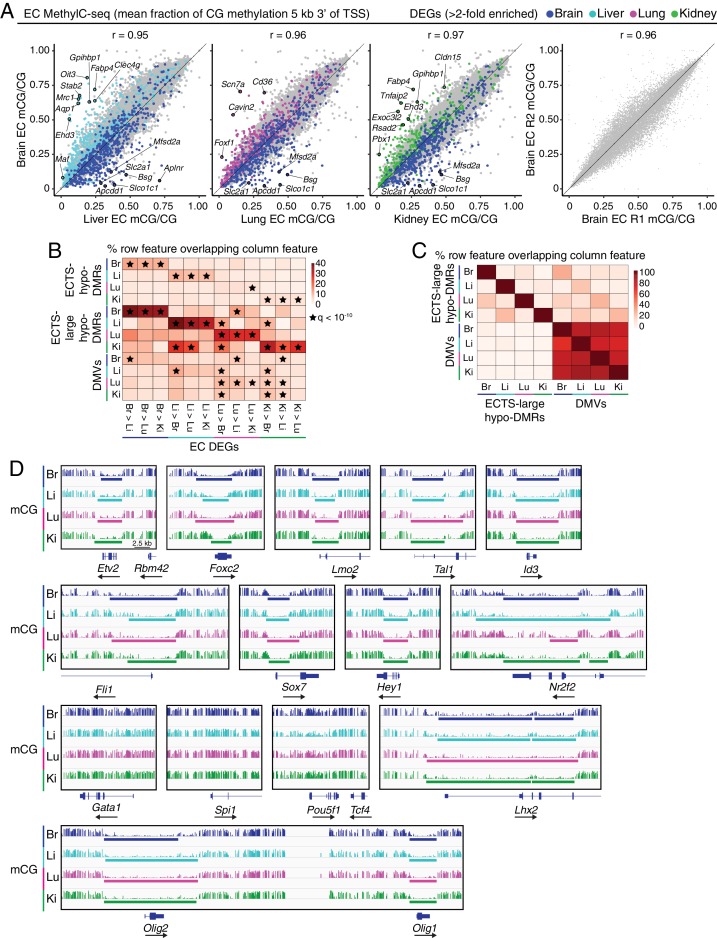
Figure 2.

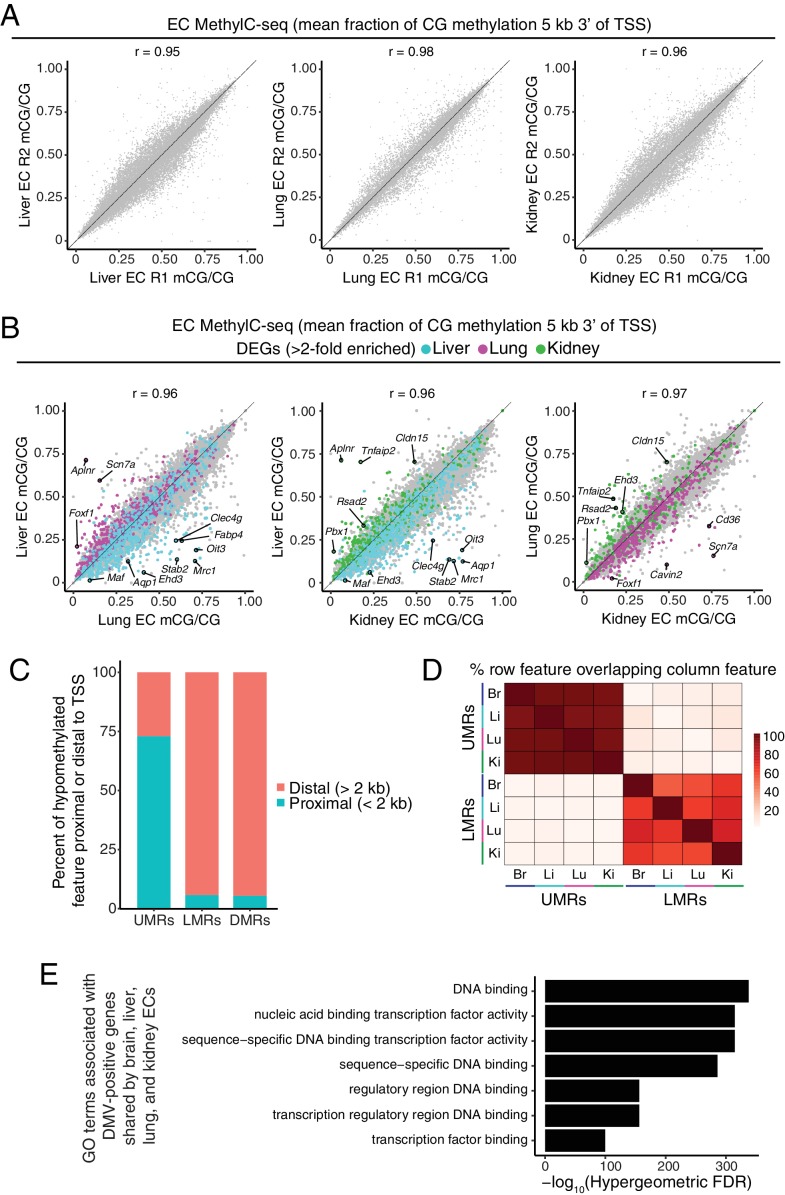
Figure 2—figure supplement 1. Distinct classes of hypomethylated features in ECs.

Figure 2—figure supplement 1.

(A) Scatter plots comparing the mean fraction of CG methylation in a 5 kb window immediately 3’ of the TSS for protein-coding genes for each of the peripheral EC biological replicates. (B) Scatter plots comparing the mean fraction of CG methylation in a 5 kb window immediately 3’ of the TSS for protein-coding genes from liver versus lung, liver versus kidney, and lung versus kidney. Colored symbols indicate transcripts with FDR < 0.05 and enrichment >2 fold for the indicated tissue comparison. These plots show a positive correlation between EC-tissue-specific gene expression and tissue-specific hypo-methylation. (C) Barplot indicating the distribution of UMRs, LMRs, and DMRs in relation to gene TSSs. (D) Heatmap indicating percentage of overlap among UMRs and LMRs. There is more overlap between UMRs of different EC subtypes than between LMRs. (E) Gene ontology categories (McLean et al., 2010) related to TFs are strongly enriched for the genes that overlap DMVs shared by all four EC subtypes.
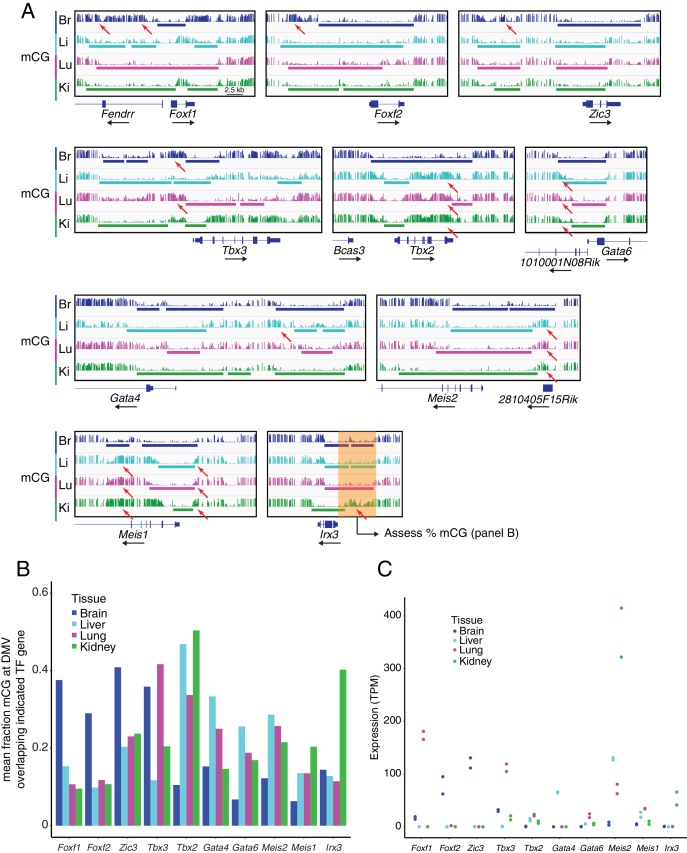
Figure 2—figure supplement 2. DMVs at differentially expressed TF genes exhibit differential methylation.

Figure 2—figure supplement 2.

(A) Genome browser images showing CG methylation at differentially expressed TF genes. Colored bars indicate DMVs. Red arrows indicate illustrative examples of differential hypermethylation. (B) Barplot indicating the mean fraction of CG methylation at DMVs overlapping the indicated TF genes. To compare the degree of methylation between EC subtypes at DMVs overlapping differentially expressed TF genes, we applied the following steps: (1) within each EC subtype, all DMVs in a 20 kb window 5’ to the TSS of the gene of interest were joined into a single contiguous block, (2) overlapping DMVs between EC subtypes were merged to generate a genomic interval that spanned the greatest extent of all the DMVs, (3) within the merged interval, the fraction mCG methylation was calculated for each EC subtype. This scheme is illustrated by the translucent orange box shown at the Irx3 locus in (A). (C) Expression levels (TPMs) based on RNA-seq for the TF genes shown in (B). Values for independent replicates are shown.