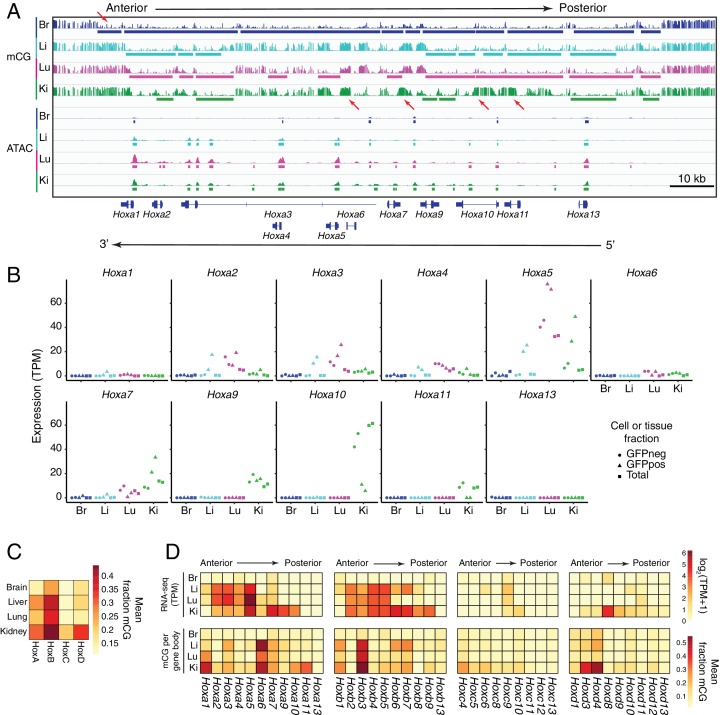
Figure 3. In ECs, patterns of methylation and gene expression at HOX gene clusters correlate with anterior/posterior position.
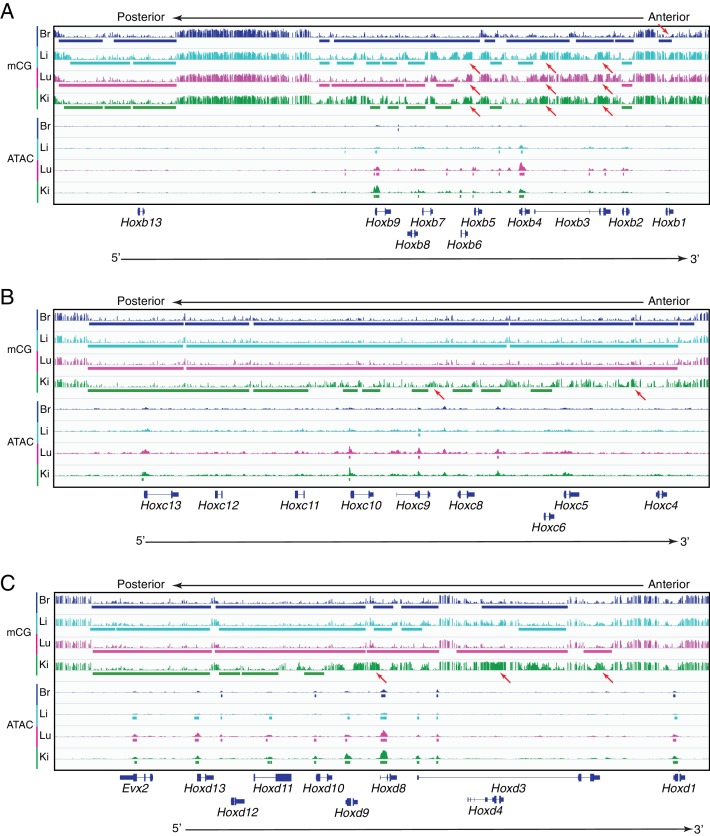
(A) Genome browser image showing CG methylation (top) and accessible chromatin (bottom) at the HOX-A gene cluster. HOX genes in this cluster are expressed in an anterior-posterior gradient corresponding to their position in the cluster, with genes near the 3’ end of the cluster expressed more anteriorly and genes near the 5’ end expressed more posteriorly. The degree of EC methylation is: brain <liver ~ lung<kidney. The degree of EC accessible chromatin is: brain <liver < lung~kidney. Colored bars indicate DMVs or ATAC-seq peaks. Red arrows pointing down indicate illustrative examples of differential hypomethylation. Red arrows pointing up indicate illustrative examples of differential hypermethylation. (B) Expression levels (TPMs) based on RNA-seq for each gene in the HOX-A cluster. (C) Heatmap depicting mean fraction of methylated CG across each HOX cluster for each EC subtype. (D) Heatmaps depicting log2(TPM +1) or mean fraction of methylated CG in the gene body for genes within each of the four HOX clusters.


