. 2018 Sep 6;7:e36187. doi: 10.7554/eLife.36187

Figure 4. Accessible chromatin and hypomethylated regions reveal candidate EC regulatory elements.

(A) Genome browser images showing CG methylation (top) and accessible chromatin (bottom) around ECTSGs. Colored bars under mCG tracks mark UMRs (upper row) and LMRs (lower row). For accessible chromatin, histograms of ATAC-seq reads are shown. Colored bars under ATAC tracks indicate the called ATAC-seq peaks. Vertical orange bars highlight co-localizing cell-type-specific open chromatin and differentially hypomethylated DNA. Vertical gray bars highlight shared regions of open chromatin in at least three EC subtypes. The ATAC-seq reads shown here represent the full range of ATAC-seq fragment sizes. (B) Scatter plots of normalized ATAC-seq read density (N) within ATAC-seq peaks called from <100 bp fragments. Values shown are log2(N + 1). Colored symbols correspond to peaks for which the closest annotated TSS is a differentially expressed EC-enriched gene from the indicated tissue. Lower right, comparison between two brain EC ATAC-seq biological replicates. (C) Pairwise Pearson correlation heatmaps for ATAC-seq read density within ATAC-seq peaks at promoter-proximal (<2 kb from TSS; upper left) or promoter-distal (>2 kb from TSS; upper right) and percent CG methylation in UMRs (lower left) and LMRs (lower right).

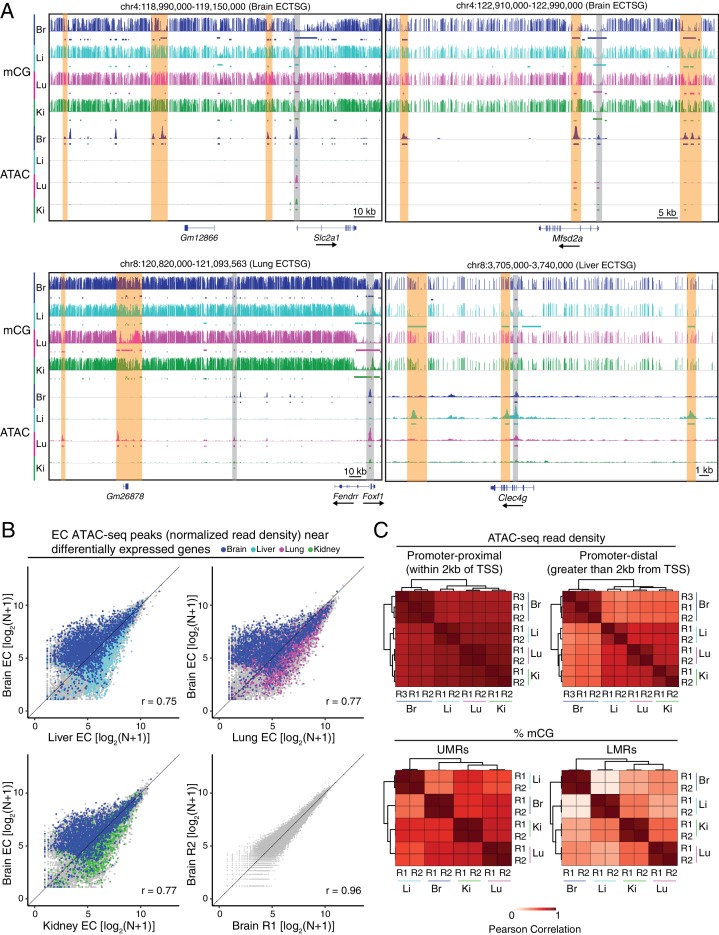
Figure 4.

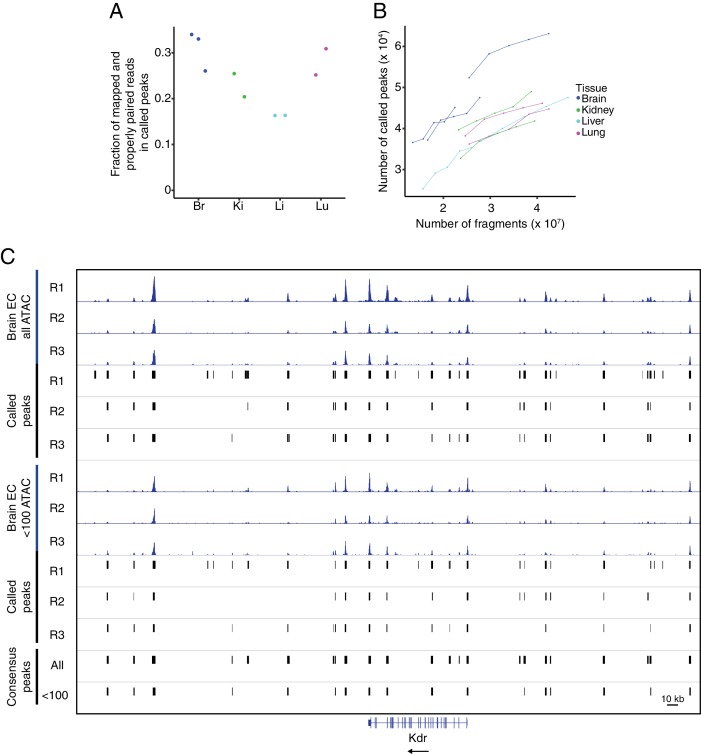
Figure 4—figure supplement 1. Quality control for ATAC-seq.

Figure 4—figure supplement 1.

(A) The fraction of mapped and properly paired reads within called peaks for each ATAC-seq replicate. (B) Peak saturation analysis for each ATAC-seq replicate. From the total number of mapped and properly paired reads, the indicated number was subsampled from each replicate and peaks were called on each subset using the standard peak calling parameters. The plot shows the number of called peaks as a function of the absolute number of fragments. (C) Genome browser image of accessible chromatin for the three brain EC replicates. Top six tracks show histograms of all ATAC-seq fragments along with the corresponding called peaks. The next six tracks show histograms using <100 bp ATAC-seq fragments along with the corresponding called peaks. The bottom two tracks show consensus called peaks using the full range of ATAC-seq fragment lengths or <100 bp ATAC-seq fragments.
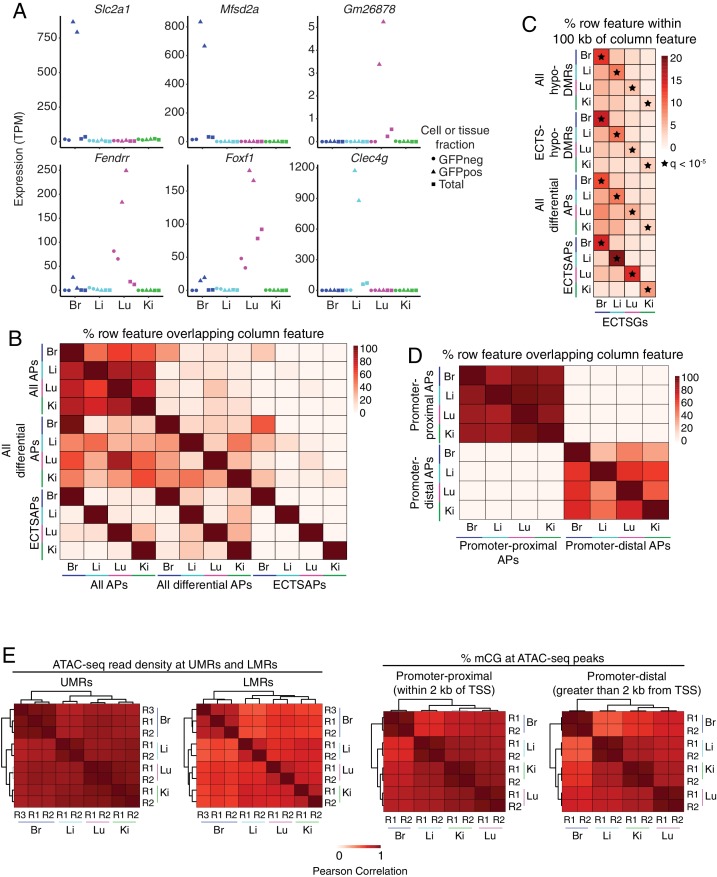
Figure 4—figure supplement 2. EC subtype differences in distal epigenetic features.

Figure 4—figure supplement 2.

(A) Expression levels (TPMs) based on RNA-seq for the genes shown in Figure 4A. (B) Heatmap depicting the percent of <100 bp ATAC-seq peaks (APs) that overlap between EC subtypes. Many of the regions of accessible chromatin overlap more than one EC subtype. ‘All APs’ refers to all ATAC-seq peaks identified in the indicated sample. ‘All differential APs’ refers to differential ATAC-seq peaks identified in the indicated sample versus any of the other three EC subtypes. ‘ECTSAPs’ refers to ATAC-seq peaks present in the indicated EC subtype but absent from the other three EC subtypes. (C) Heatmap depicting the percentage of each epigenetic feature (rows) that is found within 100 kb of ECTSGs. Tissue-specific EC candidate CREs are significantly enriched within 100 kb of ECTSGs from the same EC subtype relative to the other EC subtypes. Black stars indicate statistical significance at q < 1×10⁻⁵. ‘All hypo-DMRs’ refers to hypomethylated DMRs identified in the indicated sample versus any of the other three EC subtypes. ‘ECTS-hypo-DMRs’ refers to hypomethylated DMRs identified in the indicated samples versus all of the other three EC subtypes. (D) Heatmap depicting the percentage of either promoter-proximal or promoter-distal ATAC-seq peaks (APs) that overlap between EC subtypes. EC subtypes share more regions of accessible chromatin associated with promoters than regions of accessible chromatin that are distal to TSSs. (E) Pairwise Pearson correlation heatmaps for ATAC-seq read density at UMRs and LMRs (left pair) and percent CG methylation in promoter-proximal (<2 kb from TSS; right pair, left panel) or promoter-distal (>2 kb from TSS; right pair, right panel) ATAC-seq peaks.
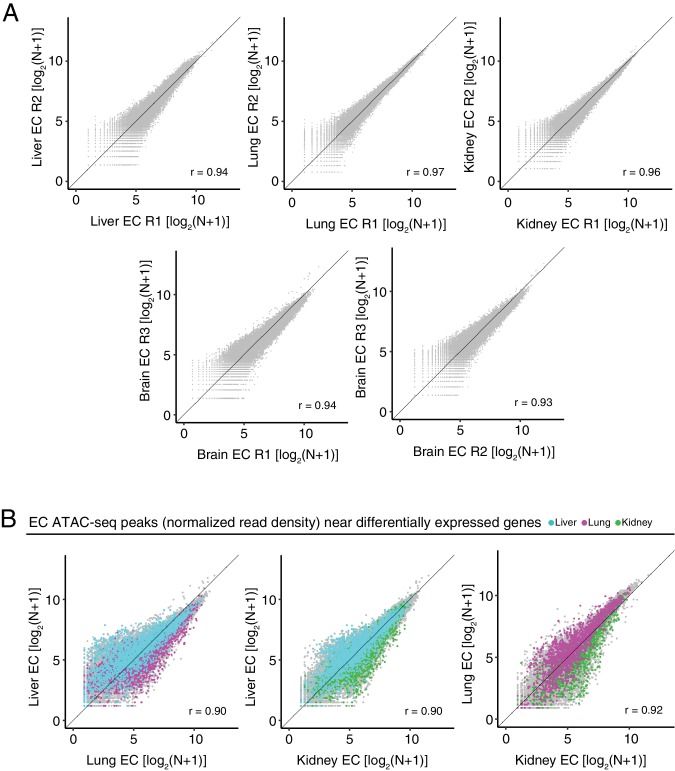
Figure 4—figure supplement 3. Differentially accessible chromatin between peripheral ECs.

Figure 4—figure supplement 3.

(A) Scatter plots of normalized ATAC-seq read density (N) within ATAC-seq peaks called from <100 bp fragments between biological replicates. (B) Scatter plots of normalized ATAC-seq read density (N) within ATAC-seq peaks called from <100 bp fragments for liver ECs versus lung ECs, liver ECs versus kidney ECs, and lung ECs versus kidney ECs. Colored symbols correspond to peaks for which the closest annotated TSS is a differentially expressed EC-enriched gene from the indicated EC subtype. Values shown are log2(N + 1).
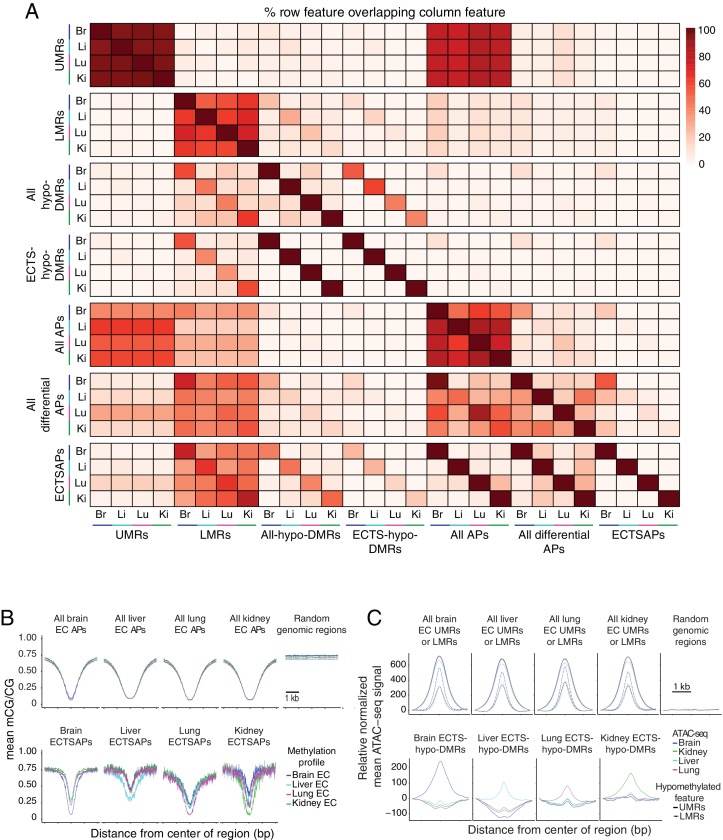
Figure 4—figure supplement 4. Relationship between accessible and hypomethylated regions of the EC genome.

Figure 4—figure supplement 4.

(A) Heatmap depicting the percentage of various epigenetic features that overlap between EC subtypes. More UMRs are shared between EC subtypes than LMRs. A larger fraction of UMRs are accessible compared to LMRs. ~ 50% of ATAC-seq peaks (APs) overlap either a UMR or an LMR. Differential ATAC-seq peaks exhibit a higher overlap with LMRs compared to UMRs. (B) Line plots showing lower mean methylation at ATAC-seq peaks (APs) compared to random size-matched genomic regions. (C) Line plots showing higher upper quartile normalized mean ATAC-seq signal at UMRs, LMRs, and ECTS-hypo-DMRs compared to random-size matched genomic regions. Each line has been translated vertically so that the value at position −1500 bp is 0.