. 2018 Sep 6;7:e36187. doi: 10.7554/eLife.36187

Figure 5. Motif enrichment analysis identifies candidate TF regulators of tissue-specific EC development and function.

(A) HOMER-identified enriched motifs in ECTS-hypo-DMRs. Frequency of the indicated motif as a function of distance from the center of ECTS-hypo-DMRs. Shown above each individual plot is the position weight matrix (PWM) of the enriched nucleotide sequence. The TF family that most closely matches the motif is indicated below the PWM. (B) Heatmap showing the fold enrichment for the indicated TF motifs (% ECTSAPs or ECTS-hypo-DMRs containing the motif divided by % GC-matched background genomic regions containing the motif). Representative members of TF families that exhibited a significant enrichment (FDR < 0.001) are shown. (C) Heatmap showing TPMs for the four EC subtypes for a subset of TFs with the motifs shown in (A). Values shown are log2(TPM +1). (D) ECTS-hypo-DMRs were centered on the motif for ERG, a member of the ETS family, and the frequencies of the indicated motifs were plotted as a function of distance from the ERG motif with a bin size of 1 bp. Black arrow: the ZIC motif ends with the sequence AGG and the ERG motif begins with the sequence AGG, thereby generating a frequency spike in all four EC subtypes at position −5 bp that represents the overlap of the two sites. Red arrow: the frequency spike for the ZIC motif at +11 bp is only present in one orientation and only in brain ECTS-hypo-DMRs centered on the ERG motif. (E) PWM for the consensus sequence of the paired ETS:ZIC motif. (F) Representative instances of the paired ETS:ZIC motif from brain ECTS-hypo-DMRs. Each instance is represented by a black rectangle. The bottom strand of the sequence in (F) matches the consensus sequence shown in (E).

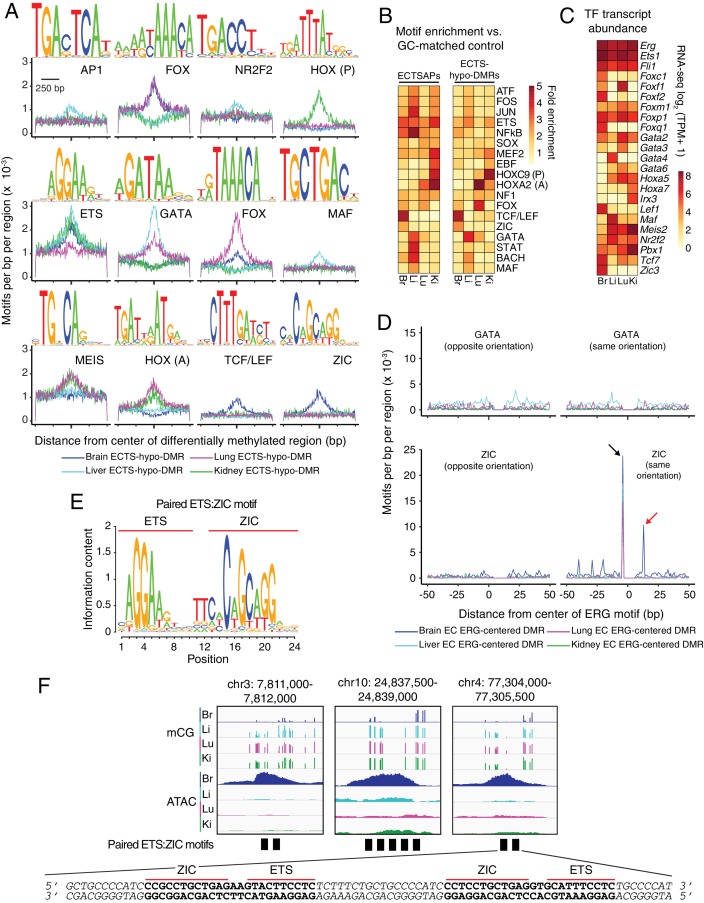
Figure 5.

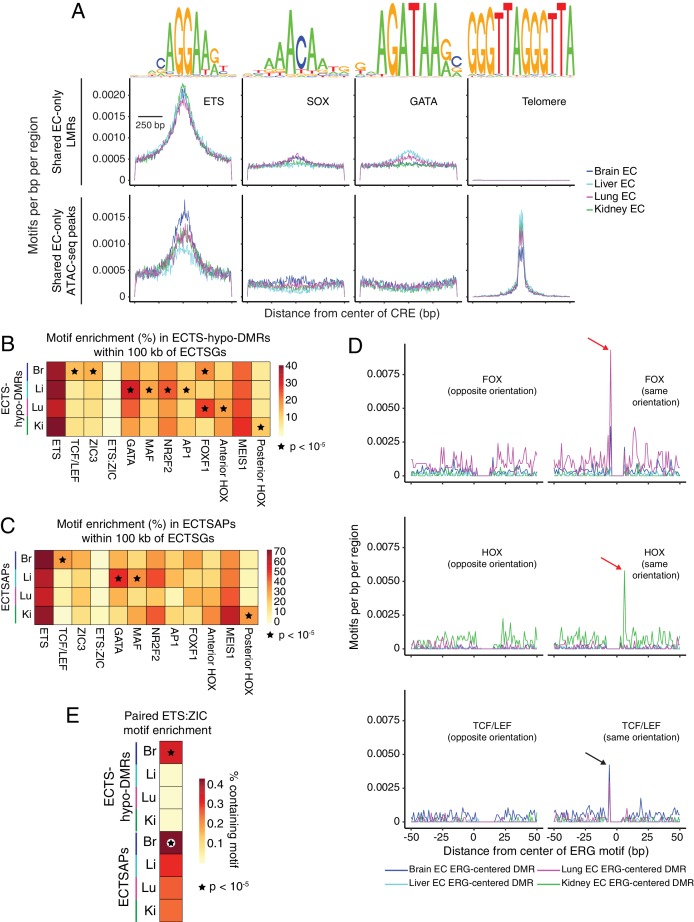
Figure 5—figure supplement 1. Candidate TF regulators of EC gene expression.

Figure 5—figure supplement 1.

(A) HOMER-identified enriched motifs in EC-only LMRs and ATAC-seq peaks shared between all four EC subtypes. Frequency of the indicated motif as a function of distance from the center of these LMRs (top) or these ATAC-seq peaks (APs) (bottom). Shown above each individual plot is the position weight matrix (PWM) of the enriched nucleotide sequence. The TF family that most closely matches the motif is indicated below the PWM. (B) Heatmap depicting the percentage of ECTS-hypo-DMRs within 100 kb of ECTSGs that contain the indicated motif. Motifs that are enriched in ECTS-hypo-DMRs (Figure 5A) are also enriched in ECTS-hypo-DMRs within 100 kb of ECTSGs. Black stars indicate statistical significance at p<1×10⁻⁵. (C) Heatmap depicting the percentage of ECTSAPs within 100 kb of ECTSGs that contain the indicated motif. Black stars indicate statistical significance at p<1×10⁻⁵. (D) ECTS-hypo-DMRs were centered on the motif for ERG, a member of the ETS family, and the frequencies of the indicated motifs were plotted as a function of distance from the ERG motif with a bin size of 1 bp. Red arrows: frequency spikes for FOX and HOX motifs are only seen in ECTS-hypo-DMRs centered on the ERG motif in lung ECs and kidney ECs, respectively. Black arrows: the sequence AGG in the TCF/LEF and ERG motifs overlap, thereby generating a frequency spike in all four EC subtypes. (E) Heatmap depicting the percentage of ECTS-hypo-DMRs or ECTSAPs that contain the paired ETS:ZIC motif. Brain EC candidate CREs show the greatest enrichment for the paired ETS:ZIC motif relative to the other three EC subtypes. Black stars indicate statistical significance at p<1×10⁻⁵.
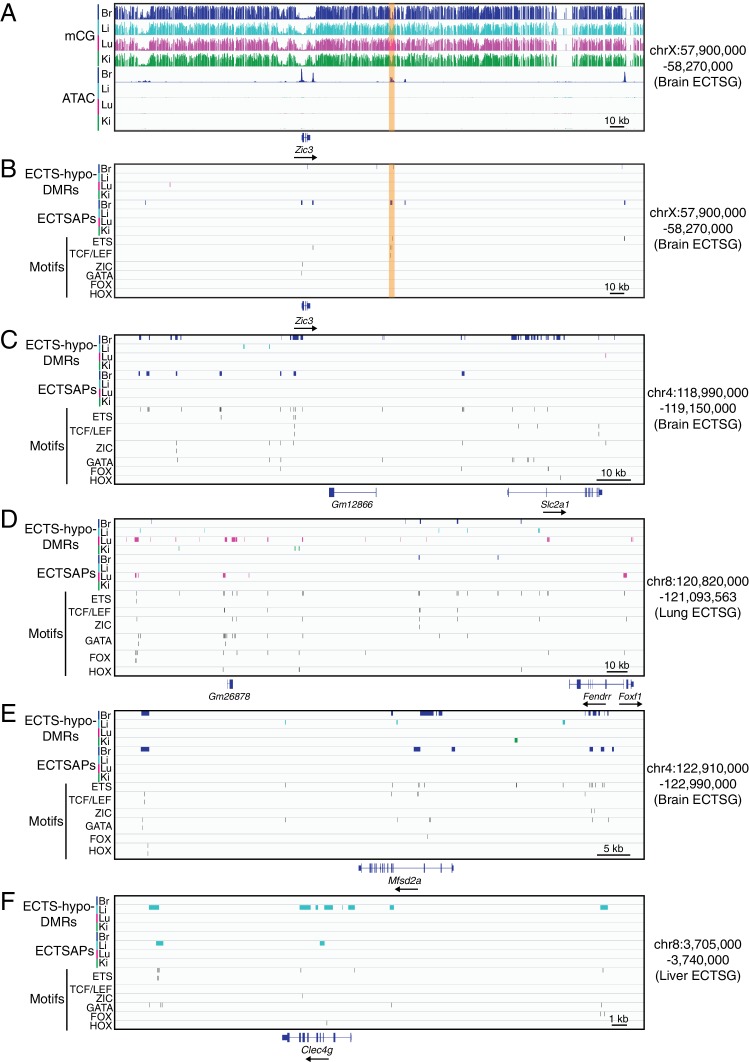
Figure 5—figure supplement 2. TF binding motifs in candidate CREs near ECTSGs.

Figure 5—figure supplement 2.

(A) Genome browser images showing CG methylation (top) and accessible chromatin (bottom) around Zic3, a brain EC-specific TF. (B–F) Genome browser images showing (from top to bottom): ECTS-hypo-DMRs (colored bars; four tracks), ECTSAPs (colored bars; four tracks), and locations of six TF motifs in the regions encompassed by ECTS-hypo-DMRs or ECTSAPs (thin vertical black lines). The genomic region in (B) corresponds to the region shown in (A), and the genomic regions in (C–F) correspond to the regions shown in Figure 4A. The patterns of EC expression are: (A,B) Zic3 – brain ECs; (C) Slc2a1 – brain ECs; (D) Foxf1 - lung and brain ECs; Fendrr – lung ECs; (E) Msfd2a – brain ECs; and (F) Clec4g – liver ECs.