. 2018 Sep 6;7:e36187. doi: 10.7554/eLife.36187

Figure 6. Canonical Wnt signaling in CNS but not peripheral ECs at E13.5.

(A–C) Coronal sections of E13.5 Tie2-Cre;R26-Tcf/Lef-LSL-H2B-GFP-6xMYC embryos near the cephalic flexure. The markers are: ICAM2 (pan-EC membrane protein), MYC (the canonical Wnt reporter), ERG (pan-EC TF), SLC2A1 (the glucose transporter GLUT1; a BBB marker), ZIC3, and DAPI. (A’–C’) Higher magnification of the boxed regions in (A–C). The boundary between CNS and peripheral tissue is marked on the DAPI image with red circles. The nuclear MYC signal reveals canonical Wnt signaling in CNS ECs (yellow arrows) but not in peripheral ECs (yellow arrowheads). ZIC3 is present in CNS ECs (yellow arrows) but not in peripheral ECs (yellow arrowheads), and in developing neurons in the ventral CNS. Scale bars in A, B, and C: 200 um. Scale bars in A’, B’, and C’: 50 um.

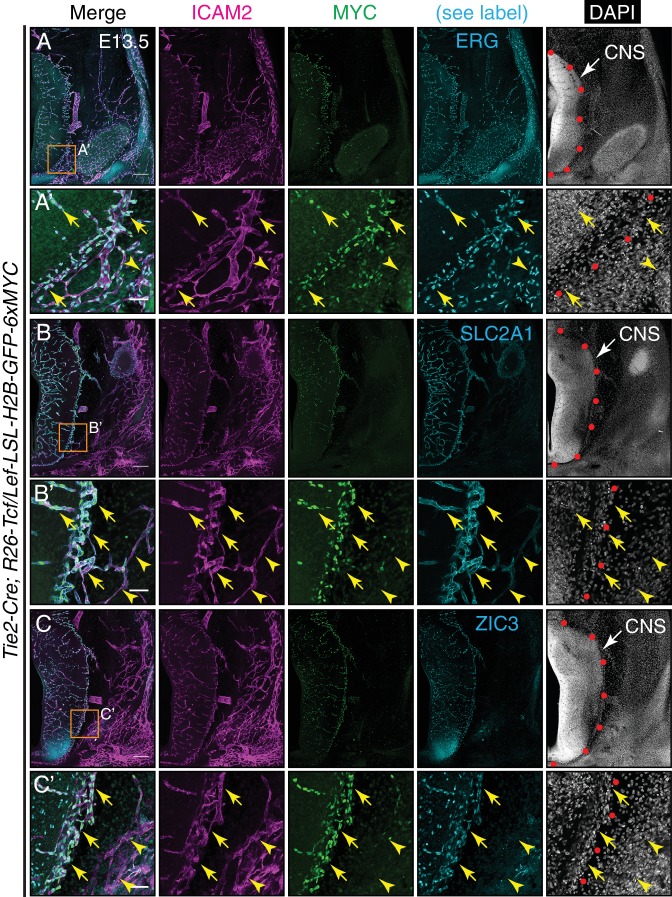
Figure 6.

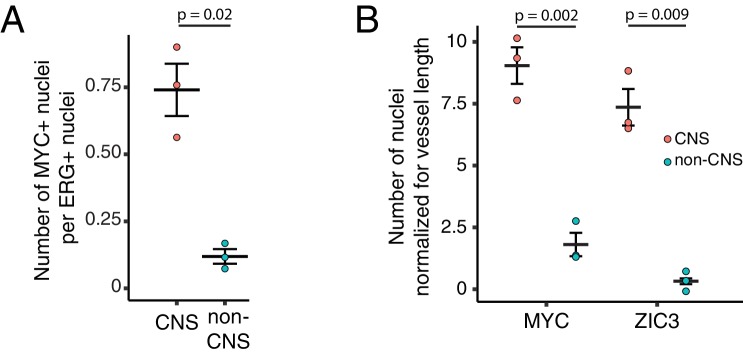
Figure 6—figure supplement 1. Quantification of immunostaining in Figure 6.

Figure 6—figure supplement 1.

(A) Quantification of Figure 6A. The values shown are the ratio of MYC +nuclei (i.e. Wnt reporter+) to ERG + nuclei. (B) Quantification of Figure 6C. The values shown are the number of either MYC +or ZIC3 +nuclei normalized for vessel length. For (A) and (B), each dot represents the quantification of a region (410 um high x 355 um wide) from the image shown in either Figure 6A or Figure 6C, within the CNS or outside of the CNS (i.e. non-CNS). For each plot, standard error of the mean is shown. p-Values are calculated with Student’s t-test.
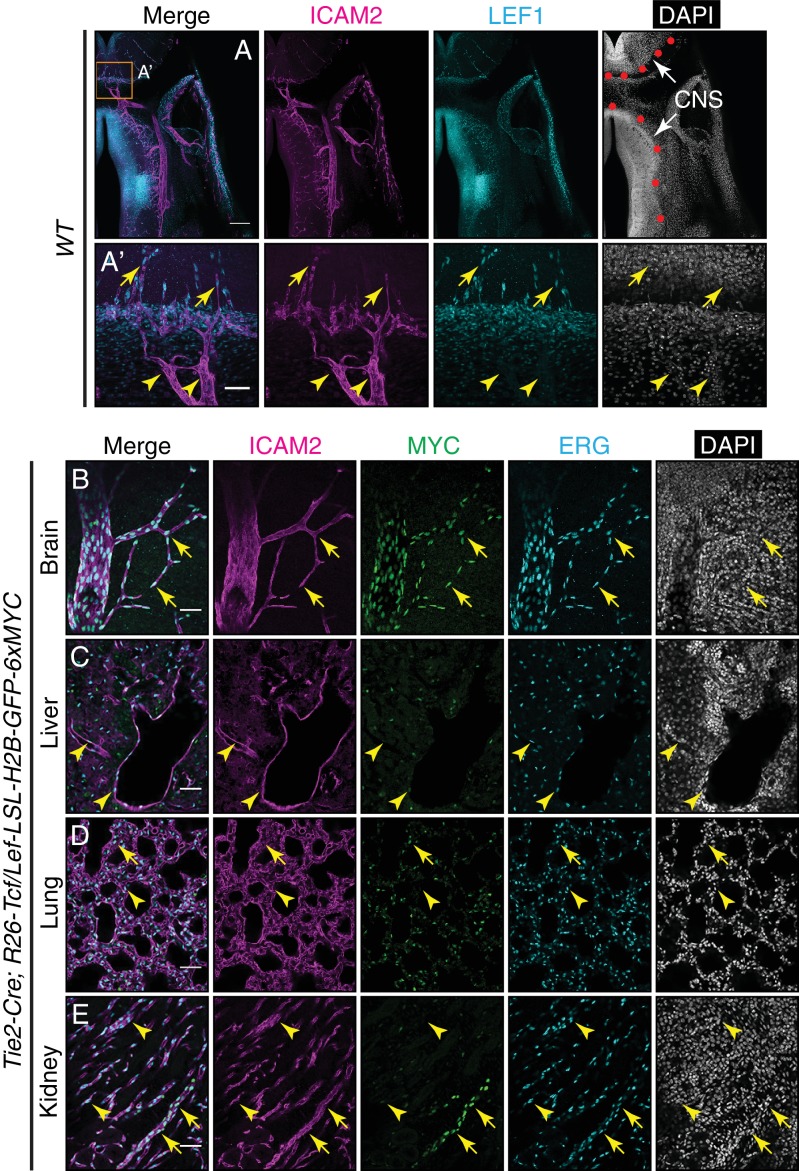
Figure 6—figure supplement 2. LEF1 in ECs in the E13.5 CNS, and canonical Wnt signaling in the P7 brain, liver, lung, and kidney.

Figure 6—figure supplement 2.

(A) Coronal sections of E13.5 Tie2-Cre;R26-Tcf/Lef-LSL-H2B-GFP-6xMYC embryos near the cephalic flexure, immunostained for the indicated markers: ICAM2, MYC, LEF1, and DAPI. (A’) Higher magnification of the boxed region in (A). The boundary between CNS and peripheral tissues is marked on the DAPI image with red circles. The nuclear MYC signal reveals canonical Wnt signaling in CNS ECs (yellow arrows) but not in peripheral ECs (yellow arrowheads). LEF1 is present in CNS ECs (yellow arrows) but not in peripheral ECs (yellow arrowheads). LEF1 is also present in developing neurons in the ventral CNS. Scale bar in A: 200 um. Scale bar in A’: 50 um. (B–E) Sections of P7 Tie2-Cre;R26-Tcf/Lef-LSL-H2B-GFP-6xMYC brain (B), liver (C), lung (D), and kidney (E). Immunostaining as in Figure 6. The nuclear MYC signal reveals canonical Wnt signaling uniformly in CNS ECs and in a subset of renal vessels (yellow arrows). LEF1 levels are below the limit of detection in all or nearly all ECs in liver and lung and in the majority of ECs in the kidney. The sparse MYC-positive nuclei in liver and lung correspond to non-ECs, most likely tissue macrophages, based on the specificity of the Tie2-Cre transgene (yellow arrowheads). Scale bar in (B–E): 50 um.