. 2018 Sep 6;7:e36187. doi: 10.7554/eLife.36187

Figure 7. Single-cell RNA-seq of P7 brain ECs reveals intra-tissue heterogeneity.

(A) t-SNE plot of 3946 P7 brain ECs showing six clusters corresponding to tip cells, and mitotic, venous, capillary-venous (Capillary-V), capillary-arterial (Capillary-A), and arterial ECs. (B) The t-SNE plot from (A) showing expression of three marker genes with enriched expression for each EC cluster. Cells with no RNA-seq reads are shown in light blue; darker blue represents greater number of reads. (C) Heatmap showing scaled expression (z-scores) for the 25 most enriched marker genes for each EC cluster. Supplementary file 8 lists the genes plotted in (C). Rows represent genes and columns represent cells.

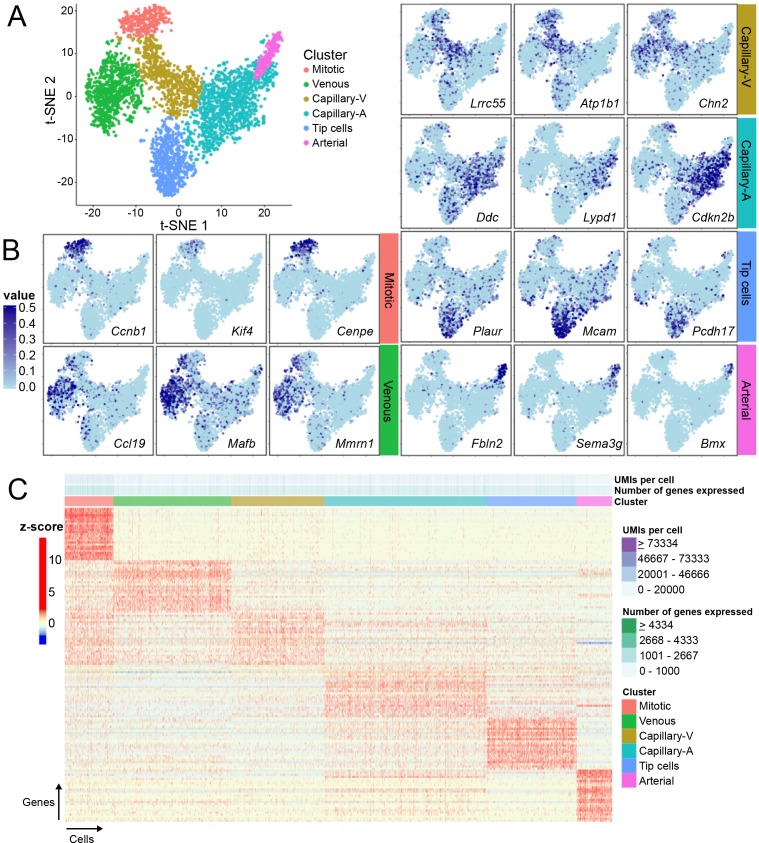
Figure 7.

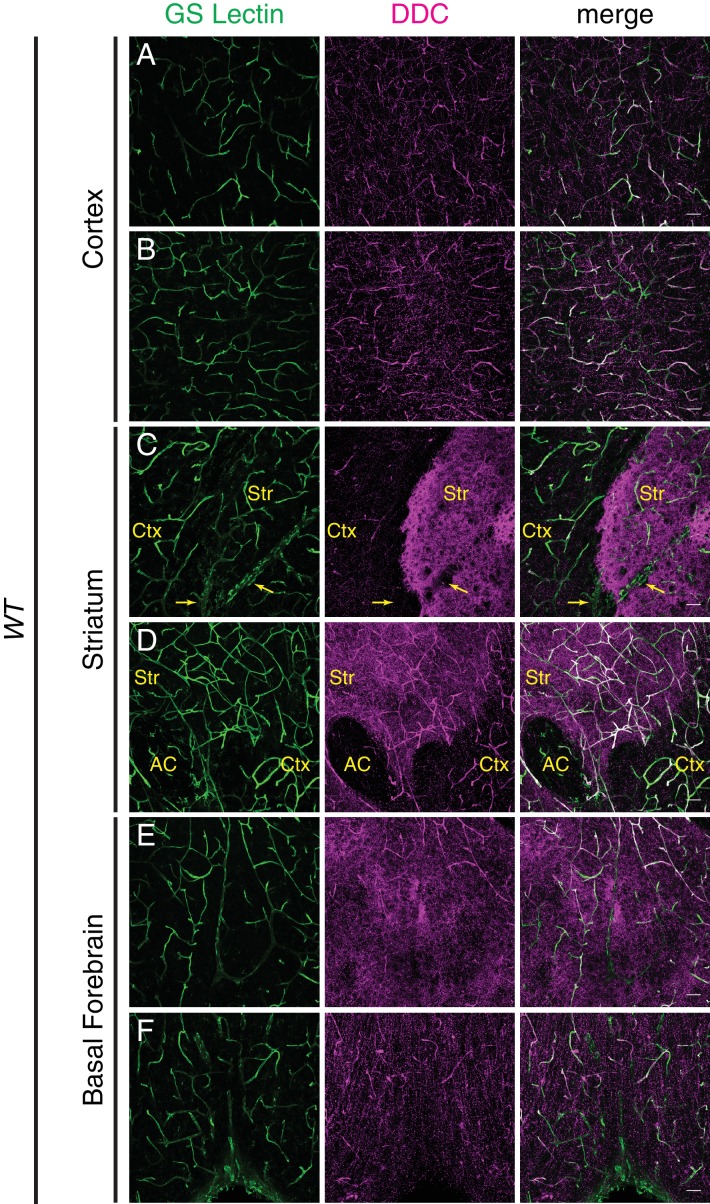
Figure 7—figure supplement 1. DOPA decarboxylase is expressed non-uniformly in the CNS vasculature.

Figure 7—figure supplement 1.

(A–F) Coronal section of a P7 C57BL/6 brain stained for either GS lectin (green) to mark blood vessels or DOPA decarboxylase (DDC; magenta). Rightmost column shows merged images. Images are from the same brain section and correspond to cortex (A and B), striatum (C and D), and basal forebrain (E and F). DDC immunoreactivity is observed in blood vessels and in axon terminals, and in the latter it appears as distinct puncta in the cortex or more concentrated staining in the striatum. Yellow arrows in (C) indicate a large vein. Str, striatum; Ctx, cortex; AC, anterior commissure; Scale bar: 50 um.