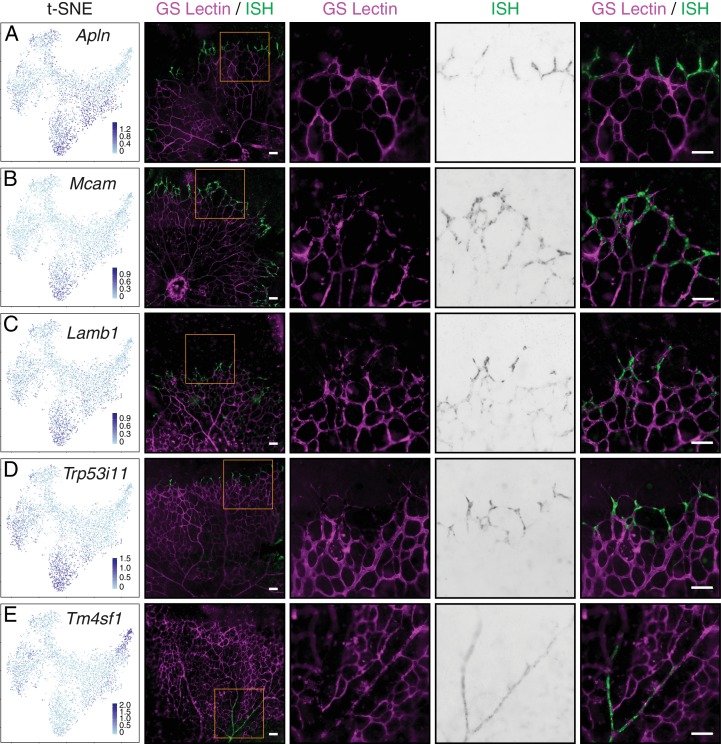
Figure 8. Single-cell RNA-seq of P7 brain ECs identifies novel tip cell markers.
(A–E) Whole mount retina in situ hybridization (ISH) for known tip cell marker Apln (A); novel tip cell markers Mcam (B), Lamb1 (C), and Trp53i11 (D); and a novel arterial marker Tm4sf1 (E). The first two columns, from left to right, are the t-SNE plot from Figure 7A showing expression of each marker gene and a low-magnification merged image of flatmount retina with blood vessels marked by GS Lectin (magenta) and ISH signal (green). The third to fifth columns showed the boxed region in column two at higher magnification, with separate signals (columns three and four) and the merged signals (column five). All scale bars are 50 um.

