. 2018 Sep 6;7:e36187. doi: 10.7554/eLife.36187

Figure 9. Cell trajectory analysis of brain ECs based on single-cell RNA-seq.

(A) Plot showing the position of cells in each EC cluster on the constructed cell trajectory. (B) Summary of the two branch points (labeled ‘1’ and ‘2’) in the cell trajectory analysis. M, mitotic; V, venous; A, arterial; T, tip cells. Examples of markers that show differential expression as cells diverge from branch points 1 and 2. Cells with no RNA-seq reads are shown in light blue; dark blue represents greater number of reads. Hey1 is enriched in arterial and tip cells (i.e. the products of the right side of branchpoint 1); Nr2f2 is enriched in venous ECs; Fbln2 is enriched in arterial ECs; and Plaur is enriched in tip cells.

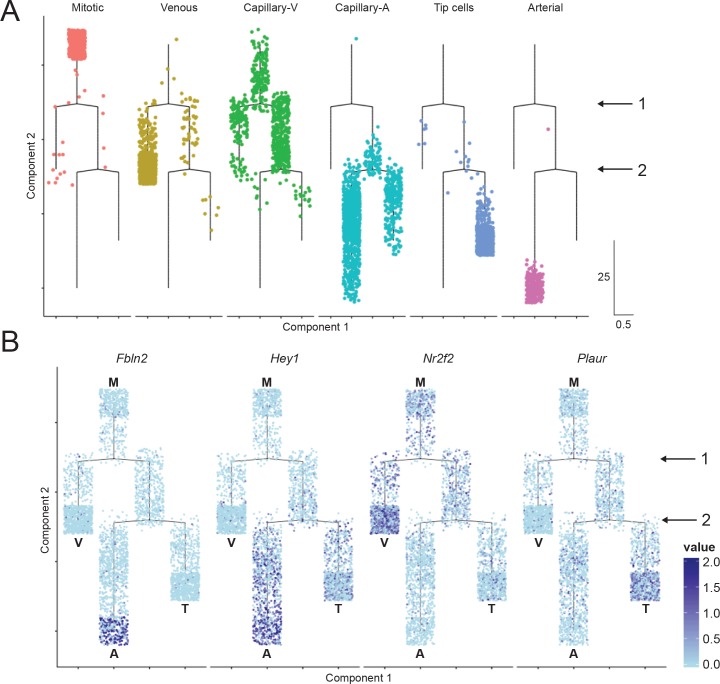
Figure 9.

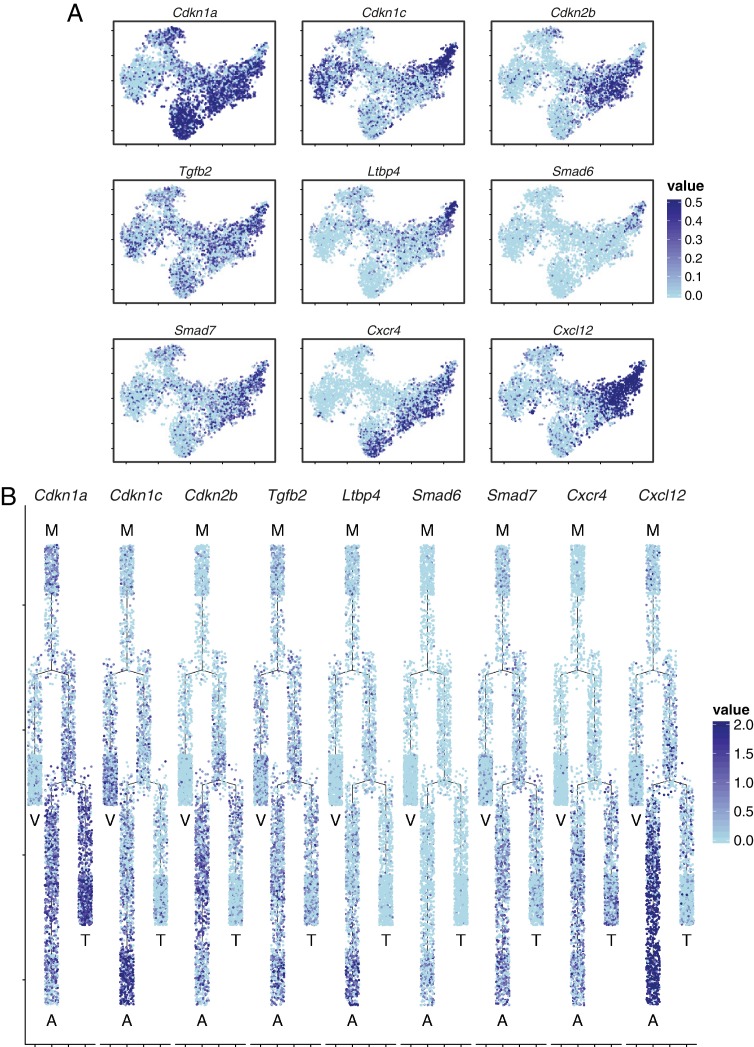
Figure 9—figure supplement 1. Brain ECs exhibit heterogeneous expression of cyclin-dependent kinase inhibitors, components of TGF-beta signaling, and components of CXCR4 signaling.

Figure 9—figure supplement 1.

(A) t-SNE plot from Figure 7A showing expression of several interesting genes. Cyclin-dependent kinase inhibitor Cdkn1a was enriched in mitotic cells, tip cells and capillary-A ECs, Cdkn1c was enriched in artery and vein ECs. Smad6 and Smad7 were enriched in the capillary-A and arterial EC clusters. Tgfb2 was widely expressed and Ltbp4 expression was concentrated in the arterial cluster. Cxcr4 was expressed in tip cells, capillary-A ECs, and arterial ECs. Cxcl12 was expressed in arterial ECs. (B) Cell trajectory analysis of genes shown in (A).