. 2018 Aug 16;7:e36316. doi: 10.7554/eLife.36316

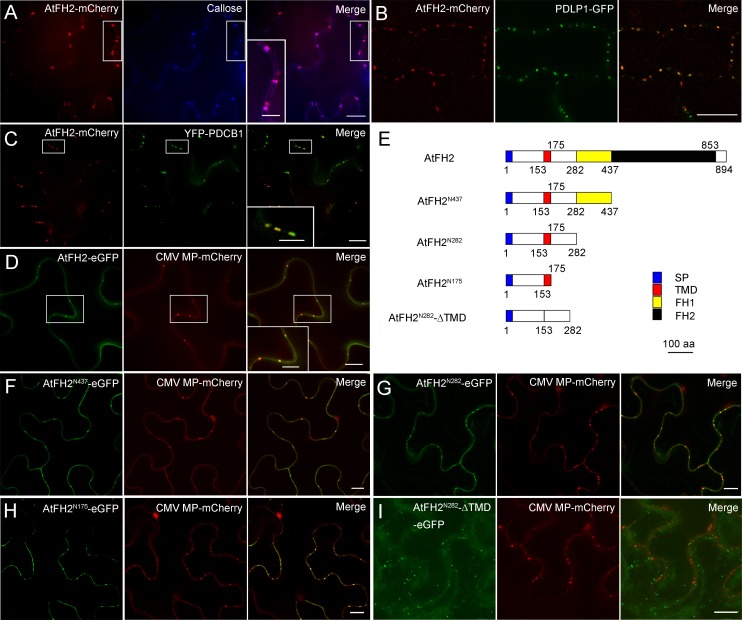
Figure 1. AtFH2 localizes to plasmodesmata and its PD localization is determined by the TM-containing N-terminus.

(A) Images of AtFH2-mCherry and callose (stained with aniline blue) in Arabidopsis epidermal pavement cells and the merged image. (B) Images of AtFH2-mCherry and PDLP1-eGFP in Arabidopsis epidermal pavement cells and the merged image. (C) Images of AtFH2-mCherry and YFP-PDCB1 in Arabidopsis epidermal pavement cells and the merged image. (D) AtFH2-eGFP, CMV MP-mCherry and the merged image in N. benthamiana leaf epidermal cells. (E) Schematic representation of AtFH2 and the truncated proteins used for the intracellular localization analysis. SP, signal peptide; TMD, trans-membrane domain. (F) AtFH2N437-eGFP, CMV MP-mCherry and the merged image in epidermal cells of N. benthamiana leaves. (G) AtFH2N282-eGFP, CMV MP-mCherry and the merged image in epidermal cells of N. benthamiana leaves. (H) AtFH2N175-eGFP, CMV MP-mCherry and the merged image in epidermal cells of N. benthamiana leaves. (I) AtFH2N282-ΔTMD-eGFP, CMV MP-mCherry and the merged image in epidermal cells of N. benthamiana leaves. Bars = 10 μm in all images, and bars = 5 μm in all inset images.

Figure 1.

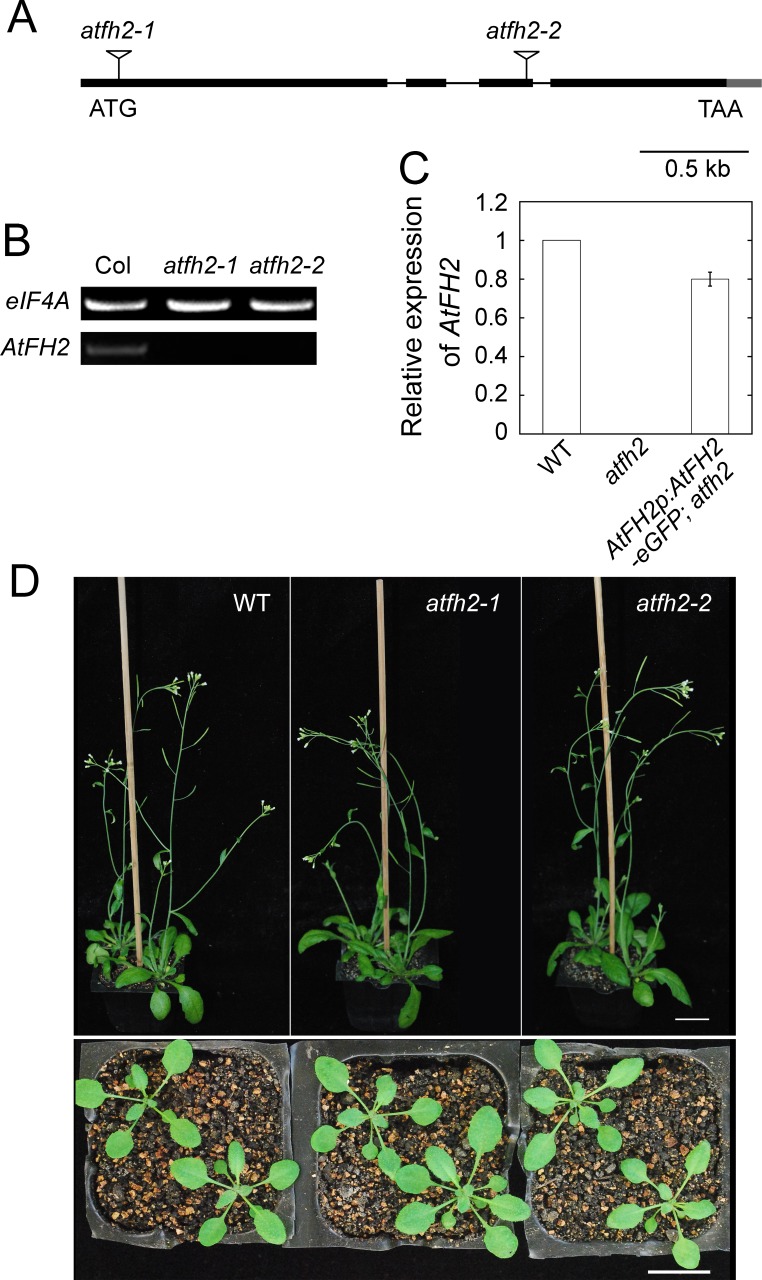
Figure 1—figure supplement 1. No overt developmental defect is detected in seedlings and adult plants of atfh2 mutants.

Figure 1—figure supplement 1.

(A) Physical structure of the AtFH2 gene. Exons, introns and untranslated regions are represented by black boxes, black lines, and grey boxes, respectively. Two T-DNA insertion lines GK_066D02 and GK_396H03 were designated as atfh2-1 and atfh2-2, respectively. Inverted triangles indicate the position of T-DNA insertions. (B) Determination of the level of AtFH2 transcripts by semi-quantitative (q) RT-PCR analysis. eIF4A was used as an internal control. (C) Determination of the level of AtFH2 transcripts in WT, atfh2-1 and AtFH2p:AtFH2-eGFP;atfh2 by qRT-PCR. AtFH2p:AtFH2-eGFP;atfh2 represents atfh2-1 mutant plants expressing AtFH2-eGFP under the control of the AtFH2 promoter. (D) Images of WT and atfh2 mutant Arabidopsis plants. The upper panel shows 8-week-old adult plants and the lower panel shows 4-week-old seedlings. Bars = 2 cm.
Figure 1—figure supplement 1—source data 1. Quantification of relative expression of AtFH2 plotted in Figure 1—figure Supplement 1C.
DOI: 10.7554/eLife.36316.005
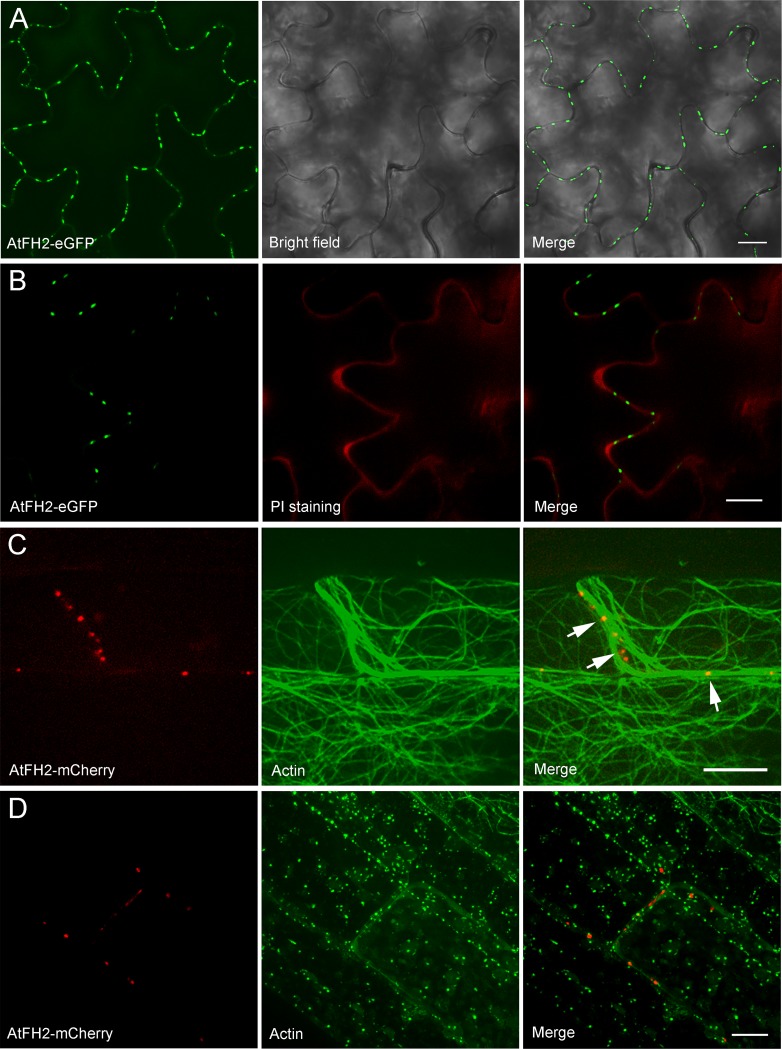
Figure 1—figure supplement 2. AtFH2 localizes to cell borders and its localization pattern does not depend on the presence of an intact actin cytoskeleton.

Figure 1—figure supplement 2.

(A) Transgenic expression of AtFH2-eGFP in Arabidopsis. eGFP fluorescence is visible as punctate spots on the boundaries of Arabidopsis epidermal pavement cells. (B) AtFH2-eGFP (green) localizes at PI-stained cross-wall regions (red). (C) Images of AtFH2-mCherry (red) and GFP-ABD2 (green) in leaf epidermal cells of AtFH2pro:AtFH2-mCherry;atfh2 Arabidopsis plants expressing 35S:GFP-ABD2. White arrows indicate punctate structures formed by AtFH2. (D) Images of AtFH2-mCherry and GFP-ABD2 in Arabidopsis hypocotyl epidermal cells in the presence of 1 μM latrunculin B (LatB). AtFH2-mCherry still forms punctate spots (left) when actin filaments are depolymerized by LatB in hypocotyl epidermal cells. Bars = 10 μm in (A–D).