. 2018 Aug 16;7:e36316. doi: 10.7554/eLife.36316

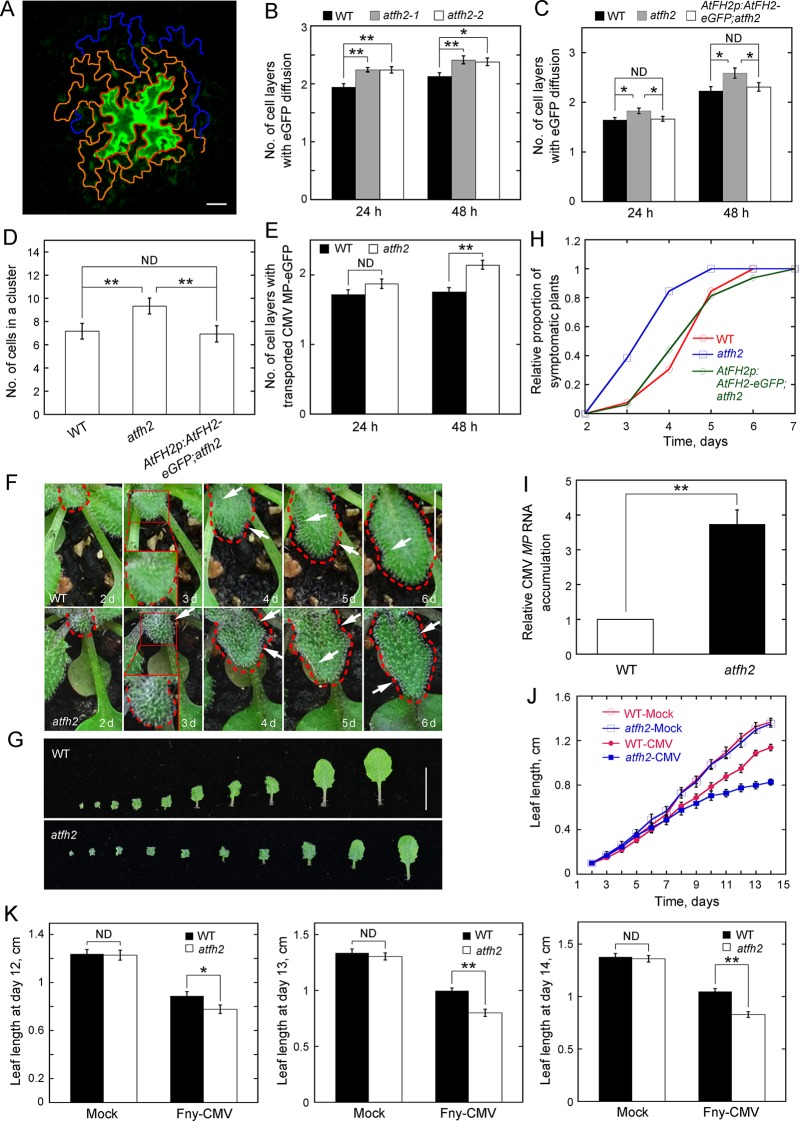
Figure 2. Loss of function of AtFH2 increases SEL of PD.

(A) Diagram of the eGFP diffusion assay in Arabidopsis epidermal pavement cells. The edge of the initial cell expressing eGFP, cells in the first diffusion layer and cells in the second diffusion layer are marked by red, orange and blue lines, respectively. Bar = 10 μm. (B, C) Quantification of the number of cell layers showing eGFP diffusion. The number of eGFP diffusion cell layers at 24 hr and 48 hr after the bombardment was counted and plotted. The experiments were repeated at least three times, and more than 30 cells expressing eGFP were counted each time. Values represent mean ± SE. ND, no statistical difference, **p<0.01 and *p<0.05 by Mann-Whitney U test. Given that atfh2-1 and atfh2-2 exhibit a similar cell-to-cell trafficking phenotype, we only used atfh2-1 as the representative AtFH2 loss-of-function mutant in the following studies. (D) Quantification of the number of cells in an eGFP diffusion cluster. The total number of cells within the cluster was counted and plotted at 24 hr after the bombardment. The experiments were repeated at least three times, and more than 30 GFP-expressing cells were counted each time. Values represent mean ± SE. ND, no statistical difference, **p<0.01 by Mann-Whitney U test. (E) Quantification of the number of cell layers showing cell-to-cell movement of CMV MP-eGFP. The experiments were repeated at least three times, and more than 30 CMV MP-eGFP-expressing cells were counted each time. Values represent mean ± SE. ND, no statistical difference, **p<0.01 by Mann-Whitney U test. (F) Symptoms of Fny-CMV infection in WT and atfh2 mutant plants. WT Arabidopsis leaves start to wrinkle at day 4, whereas atfh2 mutant leaves start to wrinkle at day 3. Wrinkles are indicated by white arrows. The edges of leaves are marked with dashed red lines. Bar = 0.5 cm. (G) Symptoms in wild type (top) and atfh2 mutant (bottom) Arabidopsis 2 weeks after systemic infection with Fny-CMV. All leaves from Arabidopsis plants 14 days after inoculation with Fny-CMV are shown. Bar = 1 cm. (H) Quantification of the Fny-CMV infection rate of WT, atfh2 mutant and AtFH2p:AtFH2-eGFP;atfh2 plants. The number of symptomatic plants (with curly leaves) was counted at different days and the relative proportion of symptomatic plants was plotted. Symptoms were evident earlier in atfh2 mutants than in WT and AtFH2p:AtFH2-eGFP;atfh2 plants. (I) Determination of the relative level of CMV MP transcripts by qRT-PCR in the newly grown small leaves of Fny-CMV-infected WT and atfh2 mutant plants at day 3. Relative CMV MP RNA accumulation represents the relative amount of virus in plants. Values represent mean ± SE, **p<0.01 by Student’s t-test. (J) Quantification of Arabidopsis leaf length 2 weeks after infection with Fny-CMV. Mock (water treatment); CMV (Fny-CMV treatment). The growth of atfh2 leaves is slower than that of WT leaves after infection with Fny-CMV. Values represent mean ± SE, n ≥ 20. (K) Quantification of Arabidopsis leaf length at days 12, 13 and 14 after inoculation with Fny-CMV. Values represent mean ± SE, n ≥ 20. **p<0.01 by Student’s t-test. ND, no statistical difference.

Figure 2—source data 1. Quantification of eGFP diffusion plotted in Figure 2B.
DOI: 10.7554/eLife.36316.022
Figure 2—source data 2. Quantification of eGFP diffusion plotted in Figure 2C.
DOI: 10.7554/eLife.36316.023
Figure 2—source data 3. Quantification of eGFP diffusion plotted in Figure 2D.
DOI: 10.7554/eLife.36316.024
Figure 2—source data 4. Quantification of CMV MP transporting plotted in Figure 2E.
DOI: 10.7554/eLife.36316.025
Figure 2—source data 5. Quantification of Fny-CMV infection plants plotted in Figure 2H.
DOI: 10.7554/eLife.36316.026
Figure 2—source data 6. Quantification of relative CMV MP RNA accumulation plotted in Figure 2I.
DOI: 10.7554/eLife.36316.027
Figure 2—source data 7. Quantification of leaf length plotted in Figure 2J.
DOI: 10.7554/eLife.36316.028
Figure 2—source data 8. Quantification of leaf length plotted in Figure 2K.
DOI: 10.7554/eLife.36316.029

Figure 2.

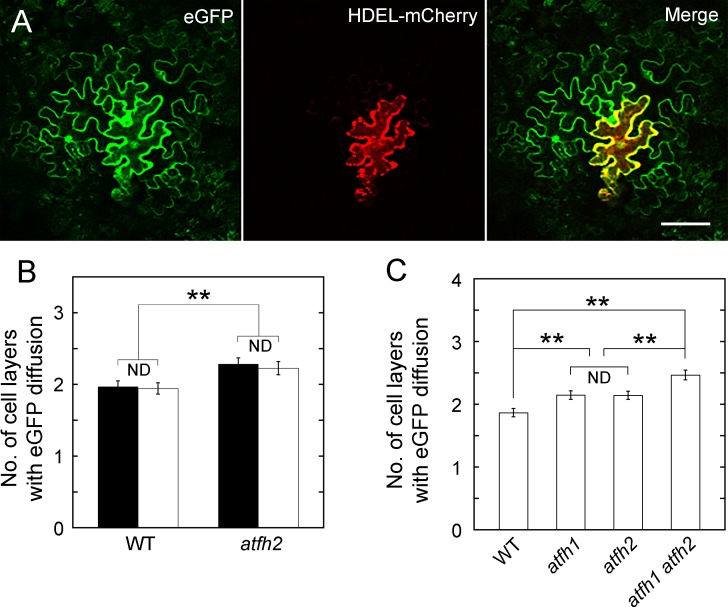
Figure 2—figure supplement 1. Loss of function of AtFH1 and/or AtFH2 increases SEL of PD.

Figure 2—figure supplement 1.

(A) eGFP, HEDL-mCherry and the merged image. A non-mobile fluorescent protein, HDEL-mCherry, was used to indicate the bombarded cell. Bar = 10 μm. (B) Quantification of eGFP diffusion cell layers in WT and atfh2-1 Arabidopsis leaf epidermal cells. The number of diffusion cell layers at 24 hr was plotted. The bombardments were performed with eGFP expressing pdGN (white columns) or pdGN plus pdGN-35S:HDEL-mCherry (black columns). (C) Quantification of eGFP diffusion cell layers in WT, atfh1, atfh2 and atfh1 atfh2 Arabidopsis leaf epidermal cells. The number of diffusion cell layers at 24 hr was plotted. The bombardments were performed with pdGN and pdGN-35S:HDEL-mCherry. Error bars represent SE, n > 30, ND, no statistical difference; **p<0.01 by Mann-Whitney U test. The experiment was repeated at least three times.
Figure 2—figure supplement 1—source data 1. Quantification of eGFP diffusion plotted in Figure 2—Figure Supplement 1B.
DOI: 10.7554/eLife.36316.009
Figure 2—figure supplement 1—source data 2. Quantification of eGFP diffusion plotted in Figure 2—Figure Supplement 1C.
DOI: 10.7554/eLife.36316.010
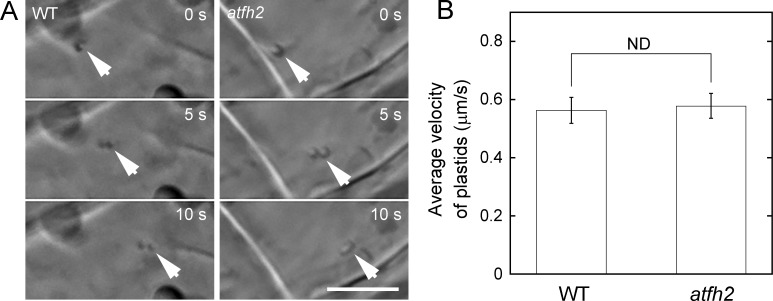
Figure 2—figure supplement 2. No overt defect of cytoplasmic streaming is detected in hypocotyl cells of atfh2 mutants.

Figure 2—figure supplement 2.

(A) Time-lapse images of plastid movement in the hypocotyl cells of wild type and atfh2-1 Arabidopsis. White arrows indicate the plastid. Bar = 10 μm. (B) Average velocity of plastids in the hypocotyl cells of wild type and atfh2-1 Arabidopsis. More than 50 data sets were collected for each genotype. ND, no statistical difference by Student’s t-test.
Figure 2—figure supplement 2—source data 1. Quantification of cytoplasmic streaming plotted in Figure 2—Figure Supplement 1B.
DOI: 10.7554/eLife.36316.012
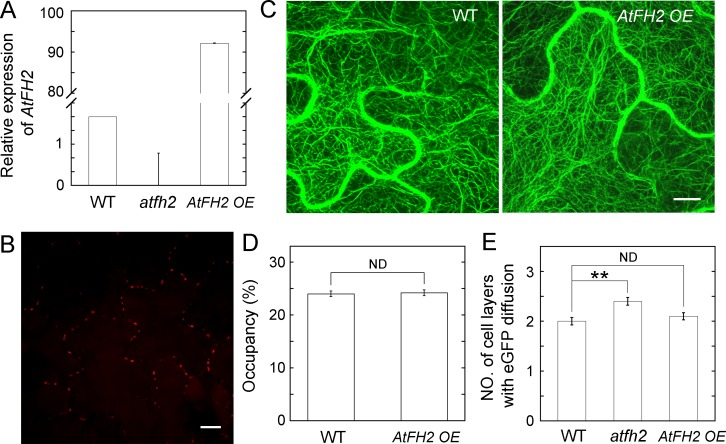
Figure 2—figure supplement 3. Overexpression of AtFH2 does not affect the overall organization of actin filaments and cell-to-cell trafficking.

Figure 2—figure supplement 3.

(A) Determination of the level of AtFH2 transcripts in WT, atfh2 mutants and AtFH2 OE plants by qRT-PCR. AtFH2 OE represents Arabidopsis plants expressing pCAMBIA1301-35S:AtFH2-mCherry. The expression of AtFH2 is relative to eIF4A. (B) Image of AtFH2-mCherry in leaf epidermal cells from AtFH2 OE plants. Bar = 10 μm. (C) Images of actin filaments decorated with GFP-ABD2 in leaf epidermal cells of WT and AtFH2 OE plants. Bar = 10 μm. (D) Quantification of the density of actin filaments in Arabidopsis leaf epidermal cells. More than 50 cells were measured for each genotype. ND, no statistical difference, by Student’s t-test. (E) Quantification of eGFP diffusion cell layers in Arabidopsis leaf epidermal cells. The number of diffusion cell layers at 24 hr was plotted. Error bars represent SE, n > 30, ND, no statistical difference; and **p<0.01 by Mann-Whitney U test. The experiment was repeated at least three times.
Figure 2—figure supplement 3—source data 1. Quantification of relative expression of AtFH2 plotted in Figure 2—Figure Supplement 3A.
DOI: 10.7554/eLife.36316.014
Figure 2—figure supplement 3—source data 2. Quantification of actin filament density plotted in Figure 2—Figure Supplement 3D.
DOI: 10.7554/eLife.36316.015
Figure 2—figure supplement 3—source data 3. Quantification of eGFP diffusion plotted in Figure 2—Figure Supplement 3E.
DOI: 10.7554/eLife.36316.016
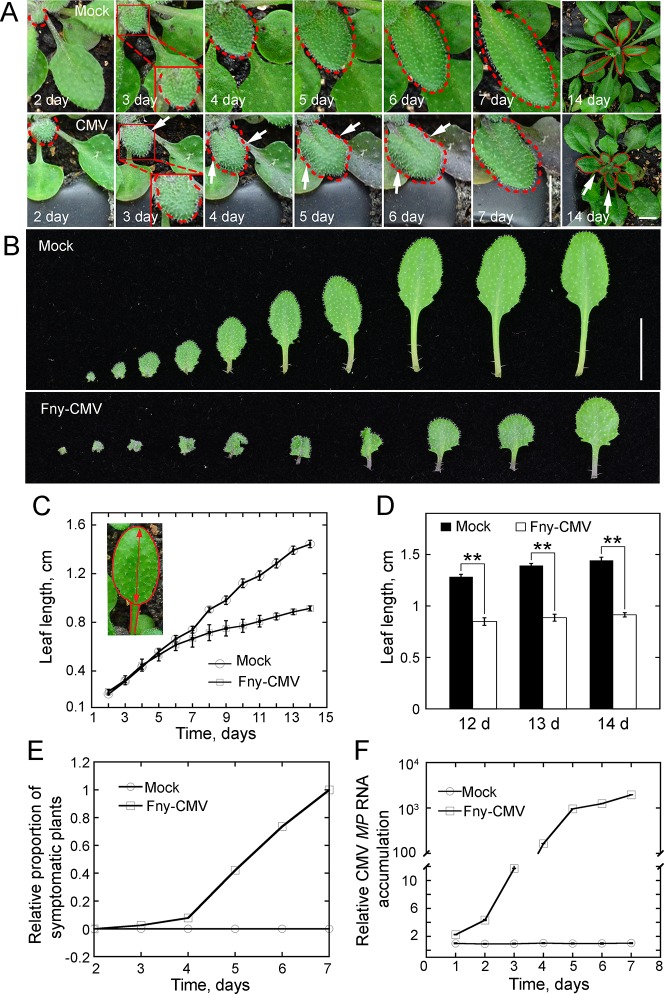
Figure 2—figure supplement 4. The symptoms of Fny-CMV infection in Arabidopsis plants.

Figure 2—figure supplement 4.

(A) Arabidopsis leaves showing symptoms of viral infection after inoculation with Fny-CMV. Compared to plants treated with water (mock), the leaves of the Fny-CMV-treated plants start to become wrinkled (indicated by white arrows) at day three after inoculation. The edges of leaves are marked with dashed red lines. Fny-CMV inoculation causes obvious distortion of systemically infected small leaves at day 14. Bar = 0.5 cm. (B) Images of Arabidopsis leaves after inoculation with Fny-CMV or mock treatment (water). All leaves from Arabidopsis plants 14 days after treatment are presented. Bar = 1 cm. (C) Quantification of average leaf length in WT Arabidopsis plants 2 weeks after inoculation with Fny-CMV. The long axis of the blade (the red arrow) was measured as the leaf length. Values represent mean ± SE, n ≥ 20. The experiments were repeated at least five times. (D) Quantification of average Arabidopsis leaf length after inoculation with Fny-CMV at days 12, 13 and 14. Values represent mean ± SE, n ≥ 20. **p<0.01 by Student’s t-test. (E) Quantification of the relative proportion of symptomatic plants after inoculation with Fny-CMV or water (mock treatment) in WT plants. The number of symptomatic plants (with curly leaves) was counted at different days and the relative proportion of symptomatic plants was plotted. (F) Determination of the level of CMV MP transcripts by qRT-PCR analysis. The measurement was performed to detect the daily viral changes in the plants after infection with Fny-CMV. Values represent mean ± SE, n > 3.
Figure 2—figure supplement 4—source data 1. Quantification of leaf length plotted in Figure 2—figure supplement 4C.
DOI: 10.7554/eLife.36316.018
Figure 2—figure supplement 4—source data 2. Quantification of leaf length plotted in Figure 2—figure supplement 4D.
DOI: 10.7554/eLife.36316.019
Figure 2—figure supplement 4—source data 3. Quantification of Fny-CMV infection plants plotted in Figure 2—figure supplement 4E.
DOI: 10.7554/eLife.36316.020
Figure 2—figure supplement 4—source data 4. Quantification of relative CMV MP RNA accumulationin Figure 2—figure supplement 4F.
DOI: 10.7554/eLife.36316.021