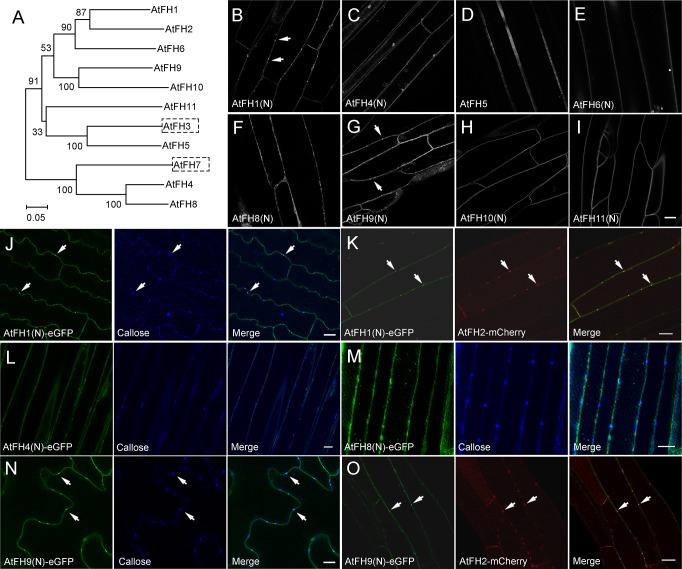
Figure 3. Determination of the intracellular localization of Arabidopsis Class I formins.
(A) Phylogenetic analysis of Class I Arabidopsis formins. The phylogenetic tree was made by MEGA 4.0 based on neighbor joining analysis. Numbers on branches represent the bootstrap values. (B–I) Examination of the intracellular localization pattern of Class I Arabidopsis formins by expressing their eGFP fusion constructs in Arabidopsis hypocotyl cells. (B) AtFH1(N)-eGFP; (C) AtFH4(N)-eGFP; (D) AtFH5-eGFP; (E) AtFH6(N)-eGFP; (F) AtFH8(N)-eGFP; (G) AtFH9(N)-eGFP; (H) AtFH10(N)-eGFP; (I) AtFH11(N)-eGFP. White arrows indicate punctate structures. (J) AtFH1(N)-eGFP, callose, and the merged image in Arabidopsis expressing 35S:AtFH1(N)-eGFP. (K) AtFH1(N)-eGFP, AtFH2-mCherry, and the merged image in Arabidopsis plants expressing 35S:AtFH1(N)-eGFP and 35S:AtFH2-mCherry. (L) AtFH4(N)-eGFP, callose, and the merged image in Arabidopsis expressing 35S:AtFH4(N)-eGFP. (M) AtFH8(N)-eGFP, callose, and the merged image in Arabidopsis expressing 35S:AtFH8(N)-eGFP. (N) AtFH9(N)-eGFP, callose, and the merged image in Arabidopsis expressing 35S:AtFH9(N)-eGFP. (O) AtFH9(N)-eGFP, AtFH2-mCherry, and the merged image in Arabidopsis plants expressing 35S:AtFH9(N)-eGFP and AtFH2pro:AtFH2-mCherry. White arrows in (J), (K), (N) and (O) indicate PD. Bars = 10 μm.


