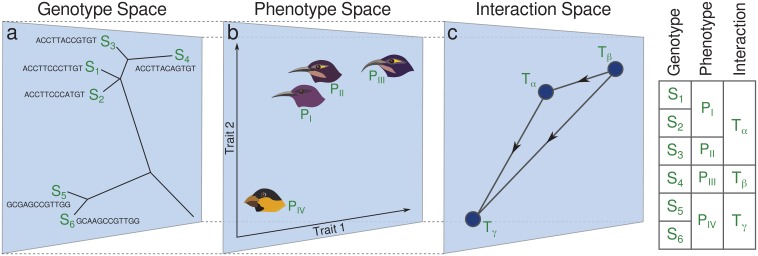
Figure 1. Link between genotype, phenotype and interaction space.
This schematic shows species in a community of grain-eating and nectar-feeding birds, living in an environment where nectar feeding is advantageous. (a) Six different genotypes (sequences ) on a distance tree genotype space. (b) Four distinct phenotypes, , are present in this space. Genotypes and are mapped to the same phenotype , and and are mapped to the same phenotype . (c) Interaction space distinguishes only three interaction traits (for definition see Model section below). and are mapped to the same interaction trait because the change of feather color does not affect ecological interactions regarding the feeding habit. The table on the right shows how the complexity of the description reduces as we map the system to interaction space.

