
Figure 1. Size of Event Clusters and Inter-rater Agreement.
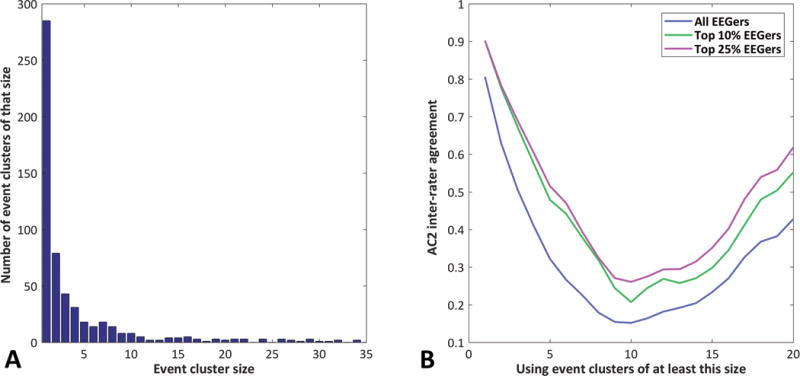
Subplot A shows the size of each event cluster (the number of EEGers that annotated an event in that cluster) versus the number of event clusters of that size. Subplot B shows the AC2 inter-rater agreement calculated using events which were labeled by a minimum number of EEGers.